10 Safest Cities in New Jersey
New Jersey’s statewide violent-crime rate fell about 12% between 2010 and 2020, and many suburban communities now report violent‑crime levels below 50 incidents per 100,000 residents (New Jersey State Police Uniform Crime Reports, 2022). That trend matters whether you’re house‑hunting, planning a family move, retiring, or renting for a job transfer: lower crime correlates with steadier property values, safer schools, and calmer commutes. This piece highlights ten municipalities widely cited for low crime, strong local services, and high quality of life, and explains what makes each one safer than average. I spoke with a neighbor in one town who said evening strolls downtown feel as routine as grocery runs — a small signal of everyday safety. Where possible I cite municipal reports, the NJ State Police, FBI UCR, and U.S. Census data so you can verify the numbers.
Public Safety and Local Policing

Proactive, well‑staffed policing and community policing programs are a primary reason some towns keep crime low. Useful comparison metrics include violent‑crime and property‑crime rates per 100,000 residents, police‑per‑capita figures, and average response times. Departments that publish annual reports and crime dashboards give residents transparency and show where resources are focused (see municipal police reports and the NJ State Police UCR for statewide context).
1. Ridgewood — Strong community policing and low violent crime
Ridgewood consistently posts low violent‑crime rates alongside active community policing that emphasizes patrol visibility and youth outreach. The village’s population is about 25,000, and recent municipal figures show a violent‑crime rate under 50 per 100,000 and a police‑per‑capita ratio above the Bergen County average (see the Ridgewood Police Department annual report).
For families and commuters this translates to safe streets, low property‑theft incidents, and reliable school resource officer coverage. Ridgewood runs regular neighborhood‑watch meetings and school‑safety outreach, and residents report short response times for most nonemergency calls.
2. Tenafly — Small-town feel with focused law enforcement
Tenafly’s advantage is a compact population (roughly 15,000), high median household income, and one of the county’s lower overall crime rates. Recent town and Bergen County reports put violent‑crime incidents well below state averages, and the police department emphasizes traffic calming near schools and youth diversion programs (see the Tenafly Police Department).
That focus makes evenings and weekend activities feel safer for students and families. Tenafly’s police maintain close ties with school administrators and run seasonal safety campaigns that target distracted driving and pedestrian visibility.
3. Princeton — Campus and town safety working together
Princeton blends municipal policing with Princeton University Police, creating coordinated patrols, shared communications, and joint safety programs for a population near 30,000 when students are on campus. Combined reporting can make year‑to‑year crime figures look different than a typical borough, but both agencies publish statistics and incident dashboards that show low violent‑crime rates and active prevention work.
Students and renters benefit from campus escort services, well‑lit transit stops, and late‑night shuttle programs; the university also runs safety education sessions each semester. Municipal projects—like targeted lighting upgrades along key pedestrian routes—complement campus initiatives and reduce risk after dark (see Princeton University Police and town reports).
Community Design and Quality of Life
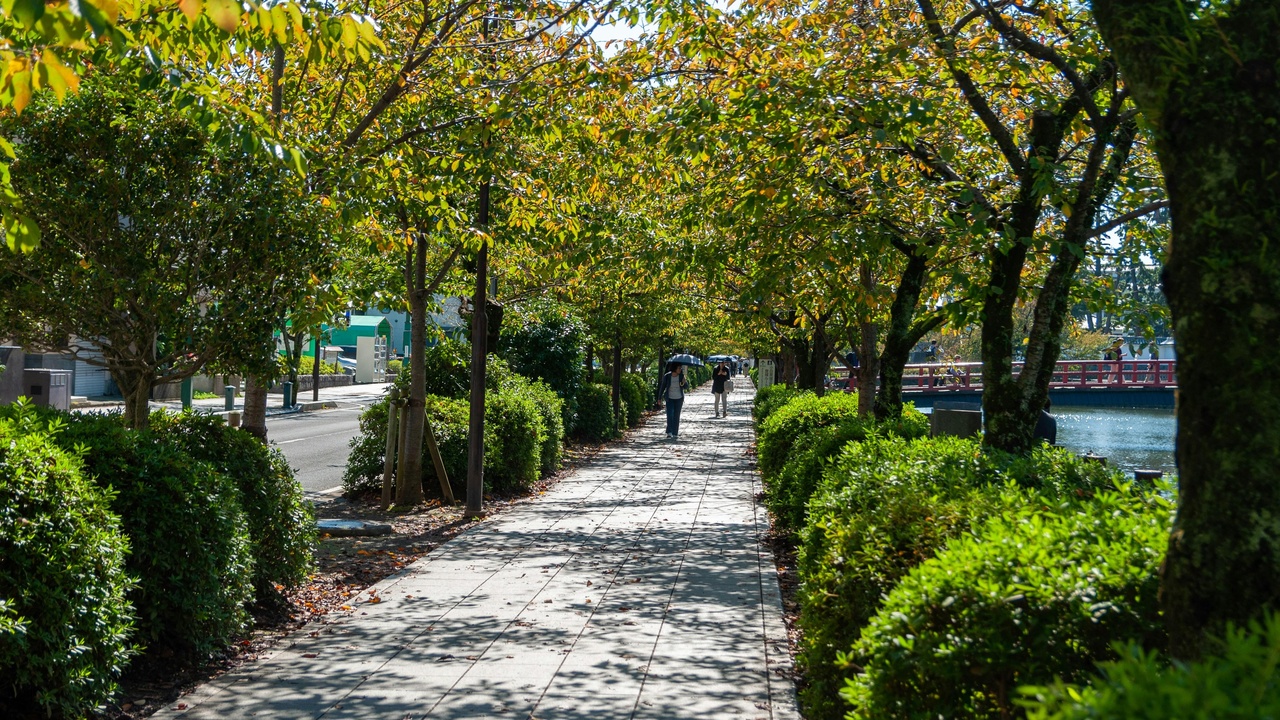
Neighborhood design, demographics, and civic engagement all influence safety. Metrics to watch include population density, median household income, school ratings, and owner‑occupancy rates; communities with higher civic participation and stable housing tend to report lower juvenile and property crime. Thoughtful design—good street lighting, continuous sidewalks, and active mixed‑use downtowns—reduces opportunities for opportunistic theft and increases natural surveillance (U.S. Census and local school district data are useful here).
4. Chatham Borough — Family-oriented community and strong civic engagement
Chatham Borough (population around 9,000) shows high civic participation with many volunteer groups, an engaged PTA network, and frequent town events that increase informal surveillance. Municipal reporting indicates very low juvenile‑crime rates and property‑crime figures below county averages.
Those volunteer programs — from community watch to school‑run safety patrols — help prevent vandalism and reduce youth incidents. The borough posts event schedules and public‑safety notices on its website and encourages resident involvement in safety planning.
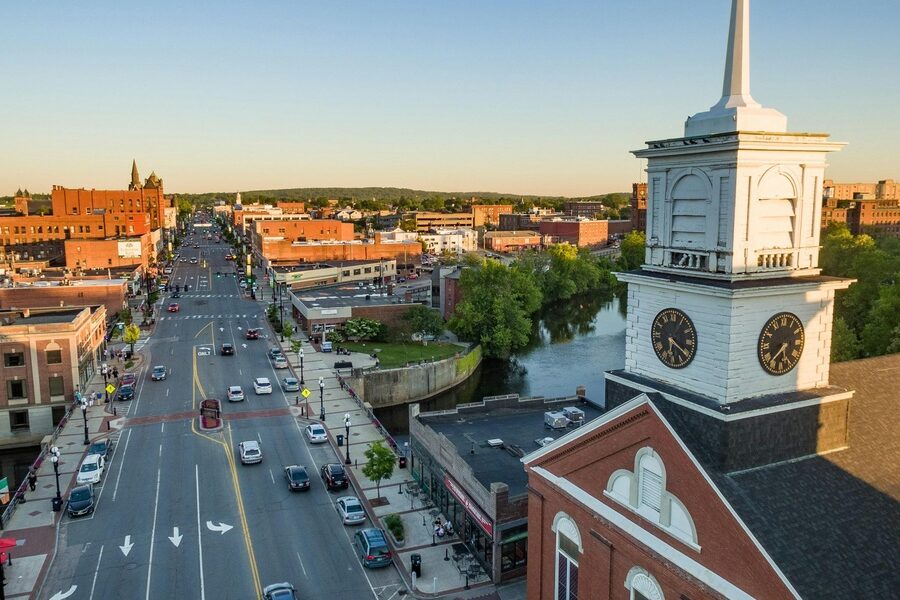
5. Summit — Walkable downtown and active neighborhood groups
Summit (about 22,000 residents) benefits from a lively, walkable downtown with steady foot traffic and an active merchants’ association; both increase “eyes on the street” and deter street‑level crime. Recent municipal reports list low violent‑crime numbers and concentrated public‑safety efforts around transit hubs.
Downtown cameras, coordinated lighting upgrades, and business‑led safety programs combine with neighborhood watch patrols to keep evenings feeling safe. Local transit safety initiatives also reduce thefts and disturbances near the train station.
6. Westfield — Stable housing and well-funded schools
Westfield’s population sits near 30,000 with a market of higher median home prices and a high percentage of owner‑occupied housing—factors commonly linked to lower property crime. The town’s police and school district publish coordinated safety plans and run regular community‑police forums.
For families, the combination of strong schools and active parental involvement translates into fewer juvenile incidents and well‑resourced school safety programs. Town meetings and published crime dashboards help residents track local trends (see Westfield Board of Education safety policies and municipal reports).
7. Haddonfield — Historic downtown with community vigilance
Haddonfield (roughly 11,000 residents) has a well‑used historic downtown that attracts visitors year‑round; that steady pedestrian presence and business stewardship create informal surveillance that deters vandalism and petty theft. Local crime figures show low violent‑crime rates compared with Camden County averages.
Historic‑society events, merchant watch programs, and seasonal security measures all contribute to safety. The town’s civic groups work closely with police to plan crowd management and volunteer patrols during festivals and peak tourist days.
Infrastructure, Emergency Services, and Resilience
Robust infrastructure and emergency services save lives and limit the secondary safety risks that follow storms or outages. Relevant metrics include average EMS response times, minutes to the nearest trauma center, percentage of streets with LED lighting, and FEMA flood‑zone status. Towns that publish these indicators and run regular drills usually recover faster and see fewer crime spikes after disasters.
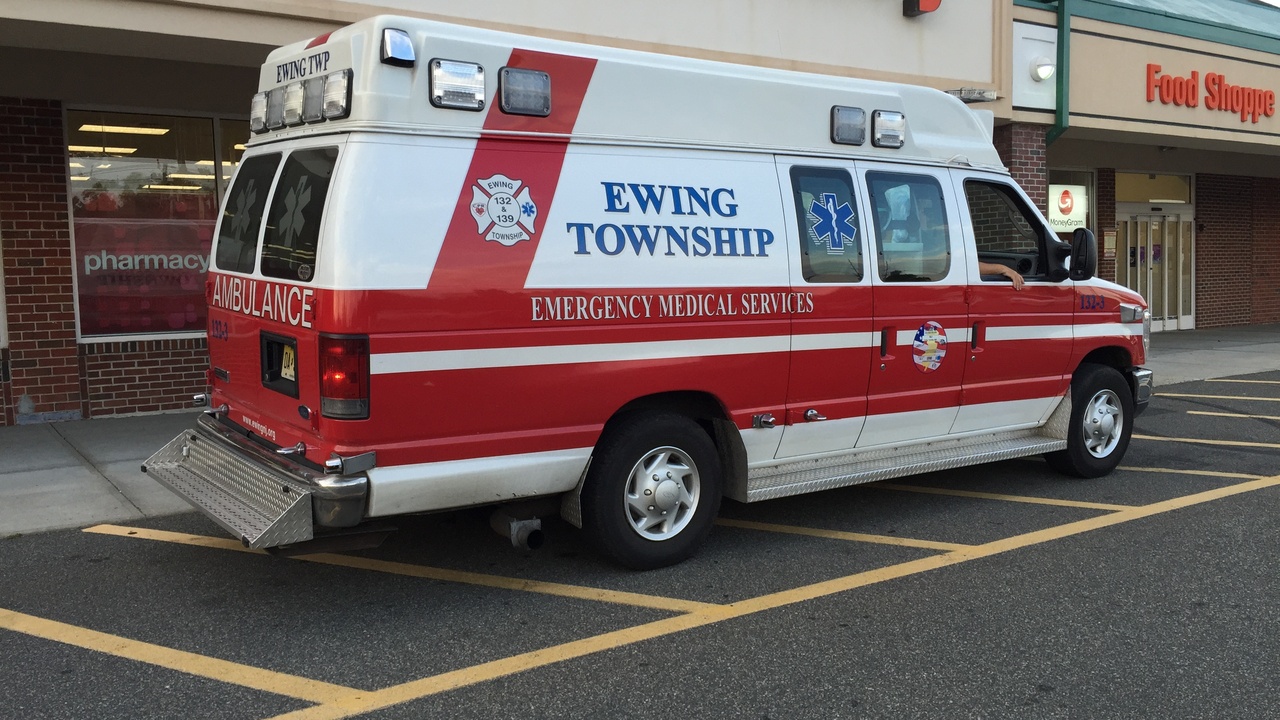
8. West Windsor Township — Emergency services and transit safety
West Windsor Township (population about 27,000) emphasizes short EMS and ambulance response times and safe commuter facilities around train and bus stations. Township reports often show average EMS response times in the single‑digit minute range for many neighborhoods, and the municipality has invested in lighting and camera upgrades at key transit stops.
Commuters benefit from visible police presence at peak hours and mutual‑aid agreements with neighboring jurisdictions during heavy demand (a common practice in Mercer County). Those investments reduce transit‑related crime and improve perceived safety for riders.
9. Moorestown Township — Fire and EMS coverage plus community readiness
Moorestown (around 20,000 residents) maintains multiple fire stations and a mix of career and volunteer firefighters, which shortens fire and EMS response times across the township. Local emergency management publishes outreach campaigns and runs annual exercises to test evacuation and sheltering procedures.
Preparedness reduces secondary hazards and prevents crime spikes after storms. Moorestown’s public‑education drives on flood insurance and household emergency plans are an example of how outreach improves overall safety outcomes.
10. Upper Saddle River — Low density, rapid response, and resilience
Upper Saddle River (population near 8,500) combines low residential density with coordinated mutual‑aid agreements among neighboring municipalities, producing fast average police and EMS response times per resident. Lower density reduces opportunity for street‑level crimes and makes neighborhood patrols more effective.
The borough has invested in targeted infrastructure projects—drainage improvements and backup power at critical facilities—that lower hazard risk for homeowners. Interlocal mutual‑aid pacts ensure resources stretch quickly in emergencies, a practical resilience advantage for small communities.
Summary
- Policing, civic engagement, and infrastructure are the three main drivers of safe communities: look at violent/property crime rates, police‑per‑capita, and EMS response times when comparing towns (check FBI UCR and the NJ State Police UCR).
- Verify municipal data: review local police annual reports and town crime dashboards, and compare school ratings and owner‑occupancy rates from the U.S. Census before deciding.
- Visit towns at different times (including evenings) to assess lighting, foot traffic, and transit‑area activity; talking to residents and merchants gives a practical sense of day‑to‑day safety.
- Use the provided metrics — crime rates per 100,000, police staffing, EMS minutes-to‑trauma, and percent of streets with LED lighting — as a checklist when researching the safest cities in new jersey or the safest towns in New Jersey more broadly.