The U.S. West Coast is where roughly 40% of American imports enter the country. Most of that cargo passes through just a handful of ports — and understanding which ones move the most volume, what they specialize in, and how they connect to the interior tells you a lot about how the entire U.S. supply chain is wired.
This guide ranks the major West Coast ports by container throughput, explains what sets each one apart, and covers the routing trade-offs that shippers, importers, and curious readers actually care about.
Table of Contents
- Quick-Reference Comparison Table
- 1. Port of Los Angeles
- 2. Port of Long Beach
- 3. Northwest Seaport Alliance (Seattle/Tacoma)
- 4. Port of Oakland
- 5. Port of San Diego
- 6. Port of Hueneme
- West Coast vs. East Coast: The Routing Trade-Off
- Port Congestion: What the Backups Taught Everyone
- Nearshoring and Shifting Volume Patterns
Quick-Reference Comparison Table {#comparison-table}
| Port | 2024 TEUs (approx.) | Key Commodities | Major Rail/Highway Access |
|---|---|---|---|
| Los Angeles | ~10.3 million | Electronics, apparel, furniture | BNSF, UP, I-710 |
| Long Beach | ~9.6 million | Electronics, retail goods, autos | BNSF, UP, I-710 |
| Northwest Seaport Alliance | ~3.8 million | Grain, autos, retail, military cargo | BNSF, UP, I-5, I-90 |
| Oakland | ~2.4 million | Agricultural exports, retail imports | BNSF, UP, I-80, I-580 |
| San Diego | ~300,000 | Vehicles, perishables | I-5, I-8 |
| Hueneme | ~200,000 | Autos, fresh produce | US-101, SR-1 |
TEU = Twenty-foot Equivalent Unit, the standard measure of container capacity
1. Port of Los Angeles {#port-of-los-angeles}
The Port of Los Angeles — sometimes called “America’s Port” — handles more container volume than any other port in the Western Hemisphere. Located in San Pedro Bay, about 25 miles south of downtown LA, it processed around 10.3 million TEUs in 2024, continuing its recovery and growth after the congestion chaos of 2021–2022.
What makes LA the dominant gateway isn’t just scale — it’s the combination of deep berths (up to 53 feet), massive terminal infrastructure, and the Alameda Corridor, a 20-mile rail expressway that funnels cargo directly from the docks to the national rail network without crossing any surface streets. That single piece of infrastructure has kept LA competitive against ports that have spent years trying to close the gap.
The port’s biggest trading partner is China, which accounts for roughly 50% of inbound containerized cargo. Electronics, furniture, and apparel dominate the mix. On the export side, LA ships out agricultural products, waste paper, and raw cotton.
2. Port of Long Beach {#port-of-long-beach}
Long Beach sits directly adjacent to Los Angeles in the same San Pedro Bay complex — the two ports together are often called the San Pedro Bay port complex, and together they form the largest port complex in the United States by a wide margin.
Long Beach handled approximately 9.6 million TEUs in 2024. While it’s technically ranked second to LA, the practical difference in daily operations is minimal; ships frequently choose between the two based on terminal availability, labor contracts, and vessel routing. The port completed a major expansion of its Middle Harbor Terminal, now one of the most automated container terminals in North America, running electric cranes and driverless guided vehicles that significantly reduce truck dwell times.
One distinction worth noting: Long Beach handles a disproportionate share of South Korean and Taiwanese cargo relative to its size, making it the preferred gateway for brands like Samsung, LG, and TSMC’s component suppliers.
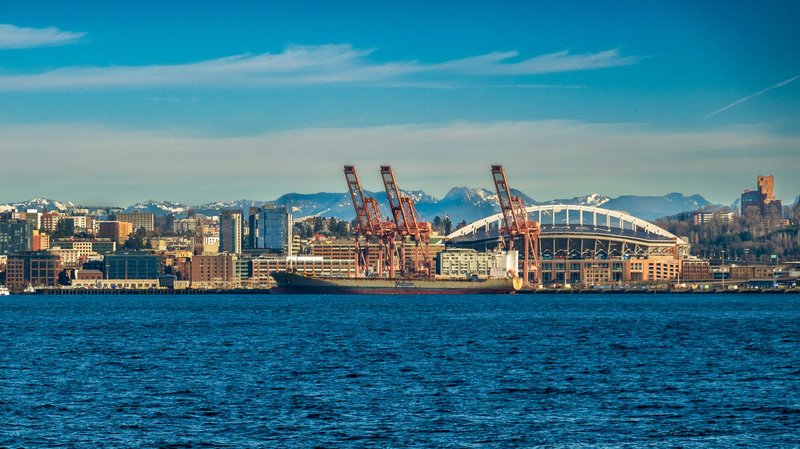
3. Northwest Seaport Alliance (Seattle/Tacoma) {#northwest-seaport-alliance}
The Northwest Seaport Alliance isn’t a single port — it’s a joint operating partnership between the Port of Seattle and the Port of Tacoma, formalized in 2015 to stop competing against each other and start competing against Oakland and the Canadian ports of Vancouver and Prince Rupert.
Combined, the NWSA moved around 3.8 million TEUs in 2024. Geographically, it’s the closest U.S. gateway to Asia — ships from Northeast Asia (Japan, Korea, China’s northern ports) save roughly a day of sailing time compared to the California ports. That transit-time advantage matters for time-sensitive cargo.
The NWSA also handles a significant volume of military cargo for the Pacific Fleet, Alaska-bound freight, and grain exports. Washington State’s agricultural output — wheat, soybeans, hay — flows heavily through Tacoma’s bulk terminals. Intermodal connections via BNSF and UP reach the Midwest in about 48 hours, making the NWSA a serious option for cargo destined for Chicago or Minneapolis.
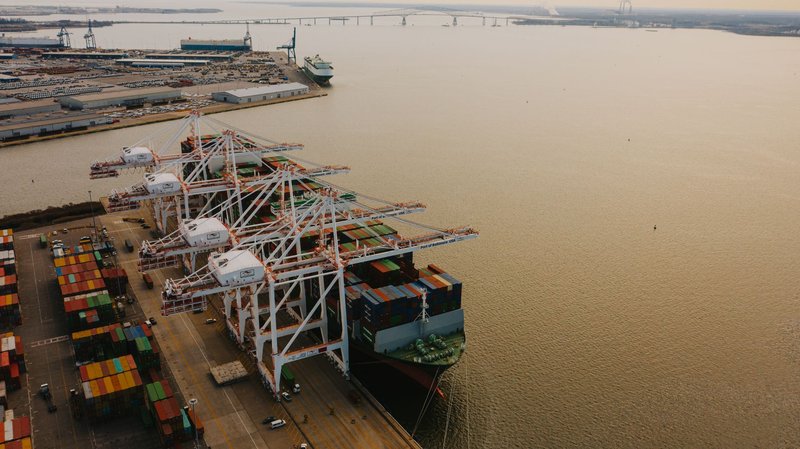
4. Port of Oakland {#port-of-oakland}
Oakland is the Bay Area’s maritime gateway and California’s third-largest container port after the San Pedro complex. It processed around 2.4 million TEUs in 2024, a rebound from softer numbers earlier in the decade.
What Oakland does better than its SoCal rivals: agricultural exports. The Central Valley — the most productive agricultural region in the United States — is effectively Oakland’s backyard, connected by rail and highway corridors that make it the natural exit point for California almonds, walnuts, wine, and refrigerated produce heading to Asia and Europe. For shippers moving food products out of the U.S., Oakland is often the cheapest and fastest option.
The port has also made significant investments in cold-chain infrastructure, adding refrigerated container yards and faster customs processing for perishables. On the import side, it receives retail goods and electronics, though at significantly lower volumes than LA/Long Beach.
5. Port of San Diego {#port-of-san-diego}
San Diego isn’t primarily a container port — it’s a mixed-use maritime hub that handles commercial cargo alongside cruise ships, Navy vessels, and sportfishing operations. Container throughput sits around 300,000 TEUs annually, which makes it a regional player rather than a national gateway.
Where San Diego punches above its weight is in vehicle imports and fresh produce. The Tenth Avenue Marine Terminal handles roll-on/roll-off (Ro-Ro) cargo: automobiles, trucks, and heavy equipment arriving from Asia and Mexico. The proximity to the U.S.-Mexico border (the busiest land border crossing in the world at San Ysidro) also makes San Diego a natural processing point for perishable goods moving north from Baja California.
Don’t expect San Diego to become a major container hub — the water depth limits the largest vessels, and there’s no realistic path to expanding the terminal footprint given the surrounding urban development. Its role is specialist, not generalist.
6. Port of Hueneme {#port-of-hueneme}
Port Hueneme (pronounced “why-NEE-mee”) sits in Ventura County, about 60 miles northwest of Los Angeles, and is the only deep-water commercial port between LA and San Francisco. It’s small by any measure — around 200,000 TEUs annually — but it has a nearly uncontested niche: automobiles and fresh produce.
The port handles a huge share of imported vehicles for the Southern California market, including Volkswagen, Audi, Porsche, and BMW vehicles arriving from Europe. It also receives massive volumes of bananas, pineapples, and other tropical produce through its temperature-controlled facilities. The Dole and Del Monte supply chains both run heavily through Hueneme.
For shippers moving high-value vehicles or perishables who want to avoid the congestion at LA/Long Beach, Hueneme offers faster turnaround times and lower terminal fees. It’s a case study in how a smaller port can thrive by owning a specific cargo segment rather than competing head-on with the giants.
West Coast vs. East Coast: The Routing Trade-Off {#west-coast-vs-east-coast}
The expansion of the Panama Canal in 2016 changed the math on East vs. West Coast routing. Larger neo-Panamax vessels can now transit the canal fully loaded, making it economically viable to route Asia-origin cargo through the Panama Canal to East Coast ports like New York/New Jersey, Savannah, or Houston.
The East Coast has gained market share steadily since then. The reasons:
- Proximity to the U.S. population center. The majority of American consumers live east of the Mississippi. Routing through Savannah or Baltimore can cut inland transportation costs for cargo destined for the Southeast and Mid-Atlantic.
- Reduced congestion risk. The 2021–2022 backlog at LA/Long Beach — where over 100 ships queued offshore for weeks — pushed many importers to diversify away from West Coast dependency.
- Labor uncertainty. West Coast dockworkers (ILWU) have historically negotiated aggressive contracts, and periodic work slowdowns create uncertainty for just-in-time supply chains.
That said, West Coast ports still hold advantages for time-sensitive transpacific cargo. Transit from Shanghai to Los Angeles runs roughly 14–16 days. Through the Panama Canal to Savannah, add another 8–10 days. For electronics, pharmaceuticals, and fashion goods where weeks matter, the West Coast remains the faster option.
Port Congestion: What the Backups Taught Everyone {#port-congestion}
The 2021–2022 congestion crisis at the San Pedro Bay complex is worth understanding, because it exposed structural vulnerabilities that haven’t fully been fixed.
At its peak in January 2022, more than 100 container ships were anchored offshore Los Angeles and Long Beach waiting for berth space. Container dwell times on the terminals stretched to 8–10 days, versus a normal 3–4 days. The backlog added weeks to supply chains and contributed to the inflation spike in goods prices that year.
The root causes were layered: a surge in import demand driven by pandemic stimulus, a truck driver shortage that meant containers sat on terminals even after being offloaded, and warehouse capacity constraints inland. The ports themselves weren’t entirely to blame, but the concentration of U.S. import volume through two adjacent facilities created a single point of failure.
Since then, the Federal Maritime Commission has pushed for demurrage and detention reforms, and both LA and Long Beach have invested in extended gate hours and appointment-based truck systems. The Alliance marine terminal at Long Beach now runs 24/7. Whether that’s enough to prevent a repeat under another demand surge is an open question.
Nearshoring and Shifting Volume Patterns {#nearshoring}
One trend worth watching: nearshoring — the move by U.S. companies to relocate manufacturing from East Asia to Mexico or Central America — is starting to show up in port volume data.
As more production shifts to Mexico, cargo that previously arrived via container ship from Shanghai increasingly arrives by truck across the southern border or through Gulf Coast ports. This doesn’t make West Coast ports irrelevant, but it does put a ceiling on the volume growth that LA and Long Beach could otherwise expect from transpacific trade.
The ports positioned to benefit most from nearshoring are those with strong land-border connections (San Diego, Laredo, El Paso) and Gulf Coast facilities (Houston, New Orleans). The West Coast majors are watching this closely. The Port of Los Angeles has been explicit in its annual reports about diversifying cargo types — adding more liquid bulk, cruise business, and clean energy cargo — to offset any transpacific softness.
The West Coast port landscape isn’t static. The same geographic advantages that made LA and Long Beach dominant — proximity to Asia, deep water, massive terminal infrastructure — still apply. But the Panama Canal expansion, nearshoring trends, and the hard lessons of 2021–2022 have all made shippers more willing to consider alternatives. For travelers and logistics professionals alike, understanding how these ports work and why they matter is the first step to understanding how almost everything you own got to your doorstep.