What a safe neighborhood looks like in the data
Crime concentrates in a few places. About half of all recorded crime in a city happens on 2% to 6% of its street segments. The other side of that pattern is that most streets record little or no violent crime in a given year. Safe neighborhoods are mostly residential, with owner-occupied homes, steady populations and little late-night commercial traffic.
How the rate is calculated
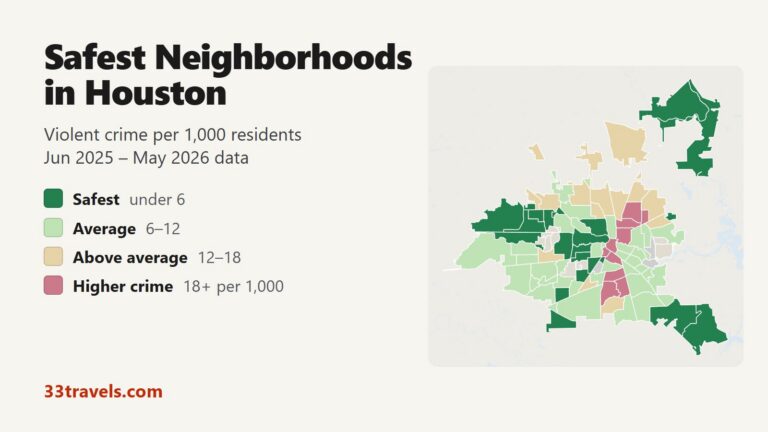
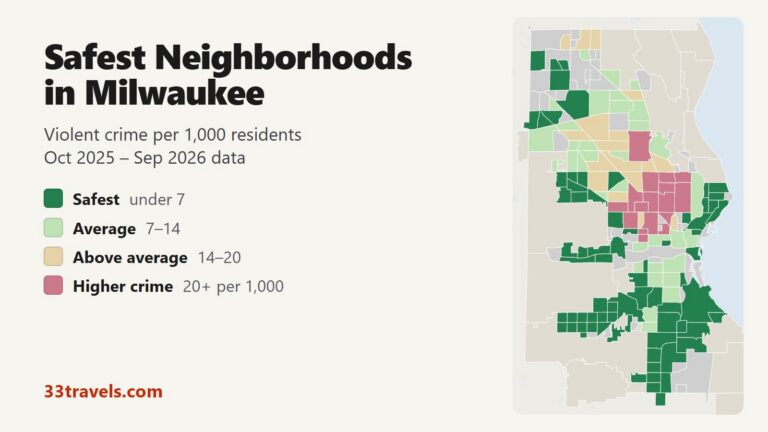
A neighborhood crime rate is the number of violent offenses in a year divided by the number of residents, multiplied by 1,000. The FBI counts four offenses as violent crime: murder and nonnegligent manslaughter, rape, robbery and aggravated assault. Property crime, such as theft and car break-ins, is counted separately and is far more common in busy shopping and nightlife districts, even ones with low violent crime.
Low rates that mislead
A rate near zero does not always mean an area is quiet. College campuses are often patrolled by their own police, whose reports are missing from city data. Parks, industrial zones and airports have few residents, so a handful of incidents produces a high or unstable rate. Small neighborhoods swing from year to year for the same reason, which is why rankings work best with a population floor.
Safest is not the same as best
The neighborhoods with the lowest crime are usually quiet residential areas far from downtown. Visitors often prefer central districts with hotels, restaurants and transit, which have more theft but are well policed and busy at night. Families tend to weigh schools and parks alongside crime. A good neighborhood guide shows the crime rate next to what each area offers.
What changes a neighborhood’s safety
Physical changes to a street can lower crime. In a Philadelphia trial, cleaning and greening vacant lots cut gun violence by 29% around the treated lots in neighborhoods below the poverty line. In New York, adding street lighting to public housing developments reduced nighttime outdoor serious crime by at least 36%.
Sources