TLDR
Ask “what’s the poorest place in the Netherlands” and you’ll get two different correct answers, because Dutch statisticians measure poverty two different ways. By poverty rate (the share of residents below the social minimum), Amsterdam tops the list at 6.6%, trailed by Vaals, Rotterdam, The Hague, and Vlieland. By average household income and wealth, the poorest places are small municipalities in the northeast — Pekela, Stadskanaal, and Veendam in Groningen — plus former mining towns Heerlen and Kerkrade in Limburg. Neither list is wrong. They’re answering different questions.
Table of Contents
- Why “poorest” has two answers
- The data at a glance
- Poorest by poverty rate: the big cities
- Poorest by average income: the small towns
- Why student towns look poor on paper
- Where the data comes from
Why “poorest has two answers” {#why-poorest-has-two-answers}
Statistics Netherlands (CBS) tracks poverty at the household level using a “not able to make ends meet” threshold, and it tracks average income and net wealth separately by municipality. Those two measurements rarely point at the same places.
Amsterdam has a high poverty rate because it has both extreme wealth and a large population living paycheck to paycheck in the same postal codes — the average masks the split. Pekela, on the other hand, has almost nobody in the top income brackets, but also very little acute crisis poverty, because the cost of living up there is lower and social ties run deep in a way that cushions hard years. Same country, two different kinds of “poor.”
That distinction matters if you’re actually trying to understand the country rather than collect a trivia answer. A ranked list that ignores it just reshuffles two unrelated datasets and calls it one story.
The data at a glance {#the-data-at-a-glance}
| Rank | City/Town | Province | Metric | Value | Year | Source |
|---|---|---|---|---|---|---|
| 1 | Amsterdam | Noord-Holland | Poverty rate | 6.6% | 2023 | CBS |
| 2 | Vaals | Limburg | Poverty rate | 6.4% | 2023 | CBS |
| 3 | Rotterdam | Zuid-Holland | Poverty rate | 6.2% | 2023 | CBS |
| 4 | The Hague | Zuid-Holland | Poverty rate | 6.1% | 2023 | CBS |
| 5 | Vlieland | Friesland | Poverty rate | 6.0% | 2023 | CBS |
| 6 | Pekela | Groningen | Avg. household income | Lowest in NL | 2023 | CBS |
| 7 | Stadskanaal | Groningen | Avg. household income | Bottom decile | 2023 | CBS |
| 8 | Veendam | Groningen | Avg. household income | Bottom decile | 2023 | CBS |
| 9 | Heerlen | Limburg | Millionaire households | Fewest per capita | 2025 | CBS |
| 10 | Kerkrade | Limburg | Millionaire households | Fewest per capita | 2025 | CBS |
National poverty rate for comparison: 3.1% in 2023, per CBS’s revised poverty methodology.
Poorest by poverty rate: the big cities {#poorest-by-poverty-rate-the-big-cities}

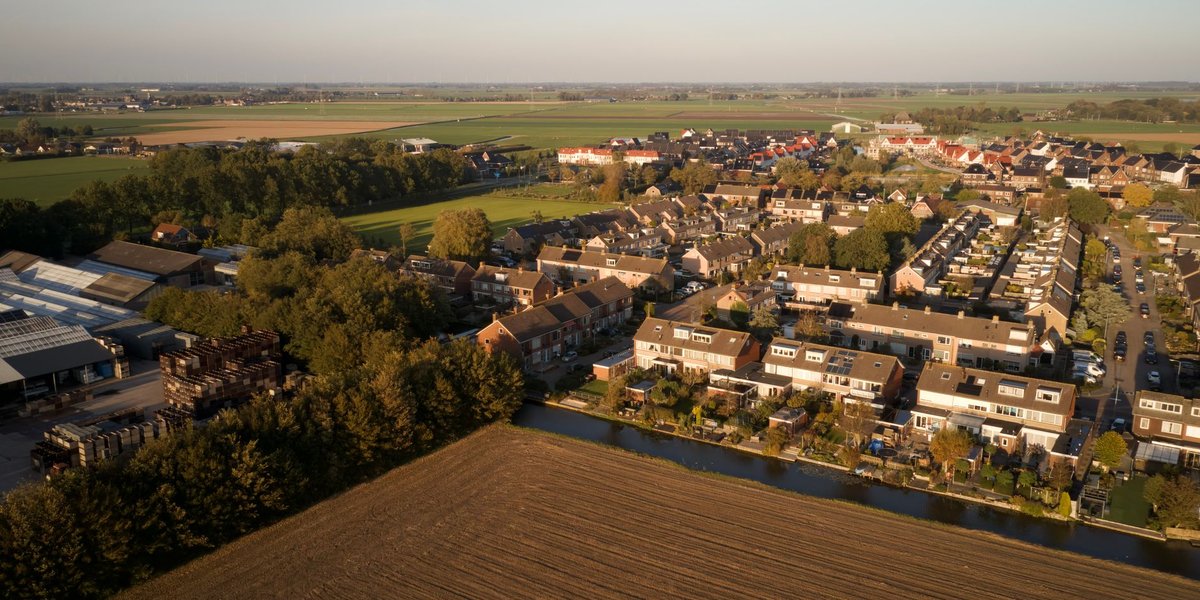
1. Amsterdam — 6.6%. The capital has the country’s highest poverty rate, and the reason is structural rather than accidental: a stretched rental market pushes low earners into shared housing and long commutes, while a small, highly visible slice of the population sits at the very top of Dutch wealth. Statistically, that produces the country’s worst poverty number even as the city’s GDP per capita outperforms almost everywhere else in the Netherlands.
2. Vaals — 6.4%. A border town wedged into the southernmost tip of Limburg, tucked against Germany and Belgium near the Drielandenpunt tripoint. Vaals draws day-trippers to its hilltop viewpoint, but the resident population skews older and lower-income, a pattern common across the towns lining this stretch of the German border.
3. Rotterdam — 6.2%. The country’s second city and its busiest port carries a poverty rate close to Amsterdam’s, driven by neighborhoods like Feijenoord and Delfshaven where post-industrial job loss hit hardest and never fully reversed. Rotterdam’s poverty is more geographically concentrated than Amsterdam’s — walk a few blocks and the numbers swing hard in either direction.
4. The Hague — 6.1%. The seat of Dutch government sits right behind Rotterdam on the list, a fact that surprises people who associate the city with embassies and ministries. The Schilderswijk and Transvaal neighborhoods carry most of that weight, areas with high immigrant populations and historically underfunded housing stock.
5. Vlieland — 6.0%. The smallest of the inhabited Wadden Islands rounds out the top five, and it’s the odd one out on this list: the economy runs on tourism and fishing, both intensely seasonal. Residents who work summer months in hospitality often show up as low-income in annual statistics even when their actual standard of living isn’t in crisis — a quirk of how seasonal income gets measured over twelve months.
Poorest by average income: the small towns {#poorest-by-average-income-the-small-towns}
6. Pekela. This municipality in eastern Groningen has held the title of the Netherlands’ lowest average household income for years, and it’s rooted in a specific collapse: Oude Pekela built its economy on strawboard and starch factories through the 20th century, and when those closed, the jobs didn’t come back. Just a fraction of Pekela households land in the country’s top income decile — a gap DutchNews reported on directly when comparing it against the country’s wealthiest town, Rozendaal, less than 200 kilometers away.
7. Stadskanaal. Neighboring Pekela in the same stretch of eastern Groningen, Stadskanaal shares its economic history almost exactly — canal-based peat and industrial jobs that dried up decades ago, replaced by a service economy that never scaled to match. An older population living on fixed pensions keeps the average income figures low even as unemployment itself has eased.
8. Veendam. Another Groningen town built on the same 19th-century peat-canal economy, Veendam later became a manufacturing hub anchored by Philips and automotive plants, most of which have since scaled back or closed. The town’s income figures sit consistently in the bottom decile nationally, tracking its neighbors along the Groningen-Drenthe border.
9. Heerlen. Southern Limburg’s coal mines closed in the 1960s and 70s, and Heerlen has spent half a century rebuilding around government offices and services instead of the industry that built it. It now has one of the lowest concentrations of millionaire households in the country, a direct statistical echo of that mining shutdown.
10. Kerkrade. Right on the German border and part of the same former coal basin as Heerlen, Kerkrade shares its neighbor’s post-mining economics almost exactly. It’s dense, historic, and visibly proud of its mining heritage — the Continium science museum sits on a former colliery site — but the wealth that industry once generated moved elsewhere.
Why student towns look poor on paper {#why-student-towns-look-poor-on-paper}

Groningen city and Wageningen don’t appear on either top-ten list above, but they show up constantly in casual “poorest Dutch cities” searches, and it’s worth explaining why. Both are dominated by university populations — tens of thousands of students living on loans, part-time jobs, and minimal declared income. That drags municipal income averages down hard, but it doesn’t reflect actual deprivation the way Pekela’s numbers do. A 22-year-old on a student budget isn’t in the same position as a 60-year-old former factory worker with no pension cushion, even if their tax returns look similar for a few years. CBS analysts flag this distinction specifically because raw municipal averages conflate the two.
It cuts the other way too: income inequality is comparatively low across the northern provinces where Pekela and Stadskanaal sit, partly because so many residents are retirees drawing similar state pensions. Low average, low spread — a very different profile from a city like Amsterdam, where the average sits higher but the gap between top and bottom is far wider.
Where the data comes from {#where-the-data-comes-from}
Every figure here traces back to Statistics Netherlands (CBS), the government body responsible for the country’s official poverty, income, and wealth statistics. CBS switched its poverty methodology in 2024, moving to a “not able to make ends meet” model that better reflects real household budgets than older relative-income thresholds — worth knowing if you see older articles citing different percentages for the same cities. Municipal income and millionaire-household figures come from CBS’s annual wealth statistics, refreshed each year as tax data becomes available.
If you’re digging into a specific town beyond this list, CBS publishes neighborhood-level data free of charge, and it’s the only source worth treating as authoritative — most travel and expat blogs on this topic are working from the same handful of CBS releases, several years removed from the original numbers.