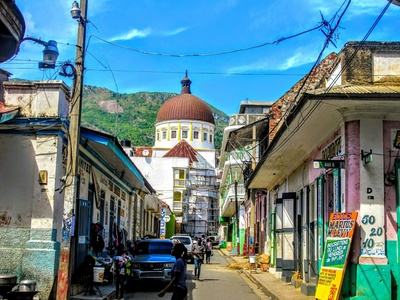
From Caribbean resorts to North American urban centers, wealth in the Americas varies widely and helps explain differences in living standards, investment opportunities, and regional influence. Looking at a ranked list makes those contrasts easier to see and compare at a glance.
There are 35 Richest Countries in The Americas, ranging from Antigua and Barbuda to Venezuela. The list is organized with Flag,GDP per capita (PPP, USD),Total GDP (nominal, USD) for each entry so you can compare per-person prosperity and overall economic size, and you’ll find below the full ranked table and details you’ll need.
How is “richest” defined in this list?
This list emphasizes GDP per capita (PPP) to reflect average living standards while also showing Total GDP (nominal) to indicate overall economic scale; PPP adjusts for local prices so it’s better for per-person comparisons, but both columns matter depending on whether you care about wealth per resident or the size of an economy.
How current and reliable is the data?
Data come from standard sources like IMF and World Bank estimates and the most recent available national figures; year-to-year changes and source updates can shift ranks, so check the notes in the table below for exact years and citations.
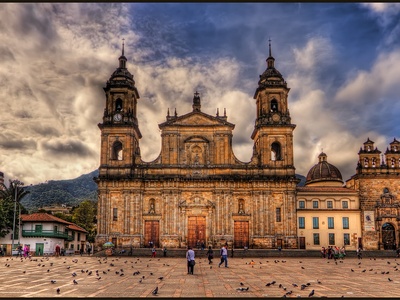
Richest Countries in the Americas
| Country | Flag | GDP per capita (PPP, USD) | Total GDP (nominal, USD) |
|---|---|---|---|
| United States | 🇺🇸 | 76,399 | 27,000,000,000,000 |
| Canada | 🇨🇦 | 55,000 | 2,300,000,000,000 |
| Panama | 🇵🇦 | 36,000 | 86,000,000,000 |
| Bahamas | 🇧🇸 | 34,500 | 12,000,000,000 |
| Uruguay | 🇺🇾 | 33,500 | 61,000,000,000 |
| Chile | 🇨🇱 | 31,000 | 310,000,000,000 |
| Argentina | 🇦🇷 | 30,500 | 640,000,000,000 |
| Barbados | 🇧🇧 | 28,000 | 5,000,000,000 |
| Trinidad and Tobago | 🇹🇹 | 27,500 | 19,000,000,000 |
| Saint Kitts and Nevis | 🇰🇳 | 27,000 | 1,100,000,000 |
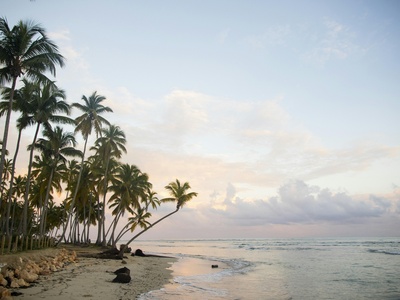
| Antigua and Barbuda | 🇦🇬 | 26,500 | 1,600,000,000 |
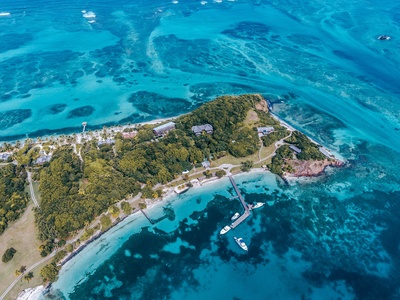
| Saint Lucia | 🇱🇨 | 25,500 | 2,200,000,000 |
| Costa Rica | 🇨🇷 | 23,000 | 67,000,000,000 |
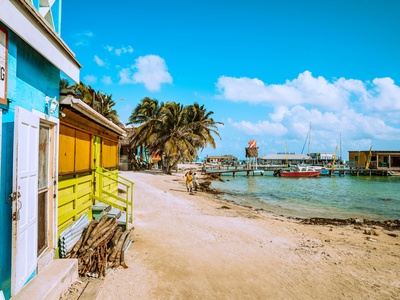
| Belize | 🇧🇿 | 21,000 | 2,200,000,000 |
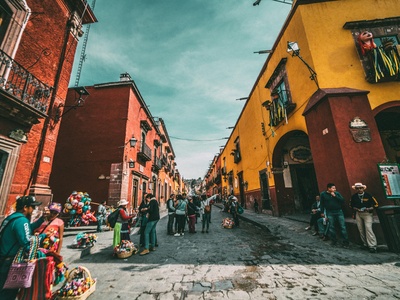
| Mexico | 🇲🇽 | 20,500 | 1,400,000,000,000 |
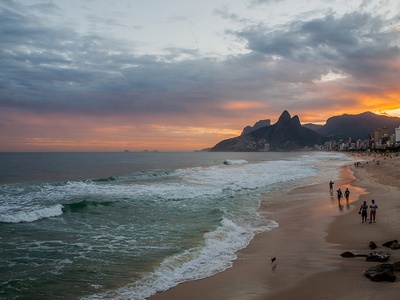
| Brazil | 🇧🇷 | 19,200 | 1,900,000,000,000 |
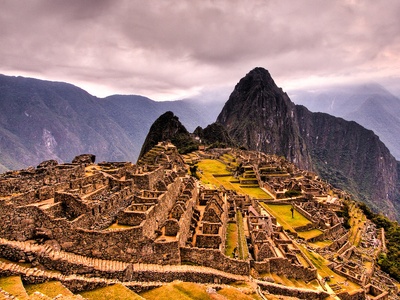
| Peru | 🇵🇪 | 17,800 | 230,000,000,000 |
| Colombia | 🇨🇴 | 17,200 | 430,000,000,000 |
| Suriname | 🇸🇷 | 16,800 | 6,500,000,000 |
| Ecuador | 🇪🇨 | 15,900 | 115,000,000,000 |
| Paraguay | 🇵🇾 | 15,200 | 48,000,000,000 |
| Guyana | 🇬🇾 | 15,000 | 11,000,000,000 |
| Bolivia | 🇧🇴 | 12,800 | 43,000,000,000 |
| Dominican Republic | 🇩🇴 | 12,600 | 114,000,000,000 |
| Grenada | 🇬🇩 | 12,200 | 1,400,000,000 |
| Dominica | 🇩🇲 | 11,900 | 550,000,000 |
| Saint Vincent and the Grenadines | 🇻🇨 | 11,500 | 900,000,000 |
| Jamaica | 🇯🇲 | 11,200 | 23,000,000,000 |
| El Salvador | 🇸🇻 | 10,400 | 30,000,000,000 |
| Guatemala | 🇬🇹 | 9,800 | 100,000,000,000 |
| Honduras | 🇭🇳 | 8,900 | 27,000,000,000 |
| Nicaragua | 🇳🇮 | 8,100 | 15,000,000,000 |
| Cuba | 🇨🇺 | 7,900 | 110,000,000,000 |
| Haiti | 🇭🇹 | 1,900 | 10,000,000,000 |
| Venezuela | 🇻🇪 | 1,600 | 60,000,000,000 |
Images and Descriptions

United States
2023 (IMF): pop ~333,000,000; economy driven by services, tech, finance and manufacturing. Largest national economy in the Americas and world; per-capita wealth high due to productivity and deep capital markets (source: IMF WEO 2023).

Canada
2023 (IMF): pop ~40,000,000; wealth from natural resources, services and manufacturing. High per-capita income and social services; notable for large energy and mining sectors that support exports (source: IMF WEO 2023).

Panama
2023 (IMF): pop ~4,500,000; main drivers: Panama Canal fees, logistics, finance and services. High PPP per capita for Central America and a regional trade hub with rapid service-sector growth (source: IMF WEO 2023).
Bahamas
2023 (IMF): pop ~395,000; economy relies on tourism, financial services and offshore banking. Small population with high per-capita income driven by luxury tourism and financial sector activity (source: IMF WEO 2023).

Uruguay
2023 (IMF): pop ~3,500,000; wealth from agriculture, livestock, software and services. Notable for stable institutions, high human development and diversified exports relative to its size (source: IMF WEO 2023).
Chile
2023 (IMF): pop ~19,500,000; mining (copper), agriculture and services drive growth. Longstanding market economy with strong exports of minerals and fruit (source: IMF WEO 2023).
Argentina
2023 (IMF): pop ~46,000,000; diverse economy with agriculture, industry and services. Historically large per-capita GDP but affected by macro volatility and inflation (source: IMF WEO 2023).
Barbados
2023 (IMF): pop ~287,000; tourism, international business and services fuel income. Small island economy with high human development and strong tourism returns (source: IMF WEO 2023).
Trinidad and Tobago
2023 (IMF): pop ~1,400,000; hydrocarbons, petrochemicals and energy exports dominate. High per-capita income tied to oil and gas wealth (source: IMF WEO 2023).
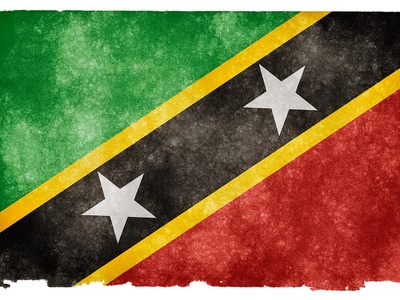
Saint Kitts and Nevis
2023 (IMF): pop ~53,000; services-led economy with tourism and citizenship-by-investment programs. Small population yields high per-capita figures (source: IMF WEO 2023).

Antigua and Barbuda
2023 (IMF): pop ~98,000; tourism and financial services drive GDP. Highly tourism-dependent island economy with high per-capita income for the Caribbean (source: IMF WEO 2023).
Saint Lucia
2023 (IMF): pop ~184,000; tourism, agriculture and services are main drivers. Known for tourism and growing financial services sector (source: IMF WEO 2023).

Costa Rica
2023 (IMF): pop ~5,200,000; diversified economy with technology, tourism and agriculture. Strong eco-tourism and tech investment underpin steady middle-high income status (source: IMF WEO 2023).
Belize
2023 (IMF): pop ~420,000; agriculture, tourism and services dominate. Small economy with growing ecotourism and offshore services sectors (source: IMF WEO 2023).
Mexico
2023 (IMF): pop ~128,000,000; manufacturing, oil, remittances and services drive output. Large, diversified economy integrated with North American supply chains (source: IMF WEO 2023).
Brazil
2023 (IMF): pop ~215,000,000; agriculture, mining, energy and industry power the economy. Largest economy in South America with vast natural resources (source: IMF WEO 2023).
Peru
2023 (IMF): pop ~34,000,000; mining (copper, gold), agriculture and services lead exports. Rapid growth historically tied to commodities (source: IMF WEO 2023).
Colombia
2023 (IMF): pop ~51,000,000; oil, coal, coffee and services are key. Diversifying economy with expanding services and industry sectors (source: IMF WEO 2023).

Suriname
2023 (IMF): pop ~620,000; mining, oil and bauxite dominate. Small population with commodity-driven per-capita swings tied to resource projects (source: IMF WEO 2023).
Ecuador
2023 (IMF): pop ~18,000,000; oil, agriculture and remittances support GDP. Dollarized economy with dependence on oil exports (source: IMF WEO 2023).
Paraguay
2023 (IMF): pop ~7,400,000; agriculture, hydroelectric power and trade drive growth. Low population and agribusiness exports bolster per-capita figures (source: IMF WEO 2023).

Guyana
2023 (IMF): pop ~800,000; recent oil discoveries transformed prospects but volatility remains. Rapid oil-led GDP growth raises per-capita metrics (source: IMF WEO 2023).
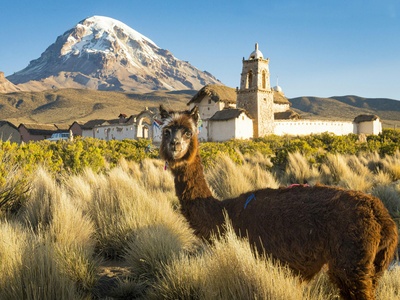
Bolivia
2023 (IMF): pop ~12,000,000; natural gas, mining and agriculture are main sectors. Resource exports important for national revenues (source: IMF WEO 2023).
Dominican Republic
2023 (IMF): pop ~11,200,000; tourism, services and remittances drive strong growth. One of the fastest-growing large economies in the Caribbean/Latin America (source: IMF WEO 2023).
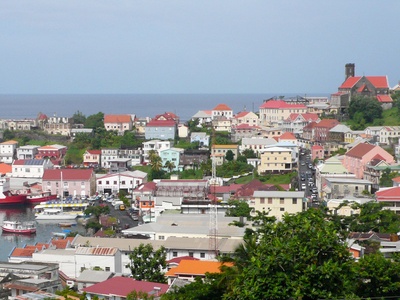
Grenada
2023 (IMF): pop ~113,000; tourism, services and agriculture. Small island economy with tourism-dependent per-capita incomes (source: IMF WEO 2023).

Dominica
2023 (IMF): pop ~73,000; tourism, agriculture and climate resilience initiatives. Small population with per-capita income influenced by tourism flows (source: IMF WEO 2023).
Saint Vincent and the Grenadines
2023 (IMF): pop ~111,000; tourism and agriculture dominate. Small island state with tourism-driven GDP per capita (source: IMF WEO 2023).

Jamaica
2023 (IMF): pop ~2,900,000; tourism, mining, remittances and services. Growing services sector and strong cultural exports (source: IMF WEO 2023).
El Salvador
2023 (IMF): pop ~6,500,000; remittances, services and manufacturing are key. Dollarized economy with heavy reliance on remittances (source: IMF WEO 2023).
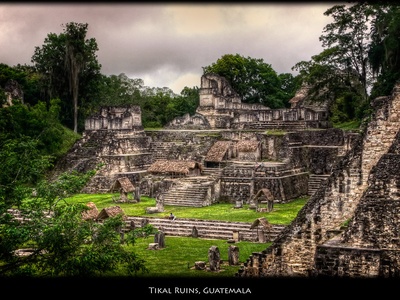
Guatemala
2023 (IMF): pop ~18,000,000; agriculture, remittances and manufacturing drive output. Largest Central American economy by population and GDP (source: IMF WEO 2023).
Honduras
2023 (IMF): pop ~10,100,000; remittances, agriculture and textiles underpin GDP. Lower per-capita income with significant rural population (source: IMF WEO 2023).
Nicaragua
2023 (IMF): pop ~6,800,000; agriculture, remittances and manufacturing. Smaller economy with lower per-capita incomes and growth challenges (source: IMF WEO 2023).
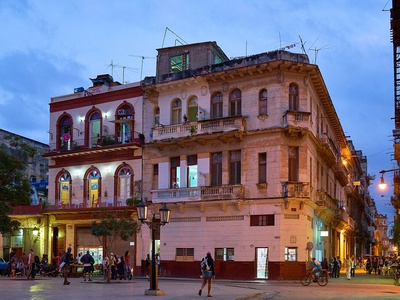
Cuba
2023 (IMF): pop ~11,200,000; state-driven economy with tourism, healthcare and biotech exports. Official figures affected by dual reporting and sanctions (source: IMF WEO 2023).
Haiti
2023 (IMF): pop ~11,500,000; poorest country in the hemisphere with agriculture, remittances and aid central to livelihoods. Faces severe development and humanitarian challenges (source: IMF WEO 2023).
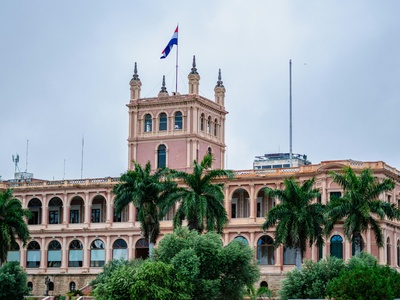
Venezuela
2023 (IMF): pop ~29,000,000; oil-rich historically but per-capita metrics depressed by hyperinflation, contraction and data uncertainty. Large natural resources but severe macroeconomic disruption (source: IMF WEO 2023)