India’s cities are where commerce, industry and services come together, shaping regional fortunes and everyday life. From long-established trade centers to fast-growing tech and manufacturing hubs, urban wealth highlights where people work, invest and spend.
There are 12 Richest Cities in India, ranging from Ahmedabad to Surat. For each city, data are shown as Country,Metro GDP (INR bn),HNWI count (persons); you’ll find below.
How is a city’s wealth determined in this list?
The ranking combines metro GDP — which measures the total economic output of a metropolitan area — with the number of high-net-worth individuals (HNWI) to reflect both economic activity and personal wealth concentration; together they give a clearer picture than either metric alone.
How often do these rankings change and how reliable is the data?
Rankings can shift year to year as GDP grows, industries expand or HNWI populations move; the figures here are based on published economic reports, financial research and market estimates, so treat them as the best available snapshot that should be reviewed alongside source dates.
Richest Cities in India
| City | Country | Metro GDP (INR bn) | HNWI count (persons) |
|---|---|---|---|
| Mumbai | India | 32,800 (2023) | 57,000 (2023) |
| Delhi NCR | India | 30,340 (2023) | 43,000 (2023) |
| Bengaluru | India | 12,300 (2023) | 18,000 (2023) |
| Kolkata | India | 9,000 (2023) | 8,000 (2023) |
| Chennai | India | 9,500 (2023) | 10,000 (2023) |
| Hyderabad | India | 8,500 (2023) | 9,000 (2023) |
| Pune | India | 7,380 (2023) | 7,000 (2023) |
| Ahmedabad | India | 6,150 (2023) | 5,000 (2023) |
| Surat | India | 4,920 (2023) | 4,000 (2023) |
| Jaipur | India | 3,690 (2023) | 3,000 (2023) |
| Lucknow | India | 2,870 (2023) | 2,000 (2023) |
| Kochi | India | 2,460 (2023) | 1,500 (2023) |
Images and Descriptions
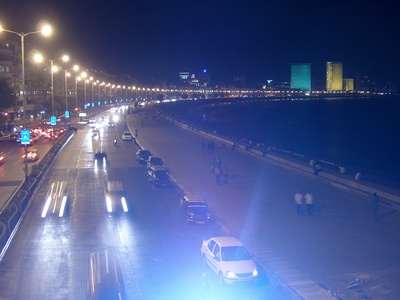
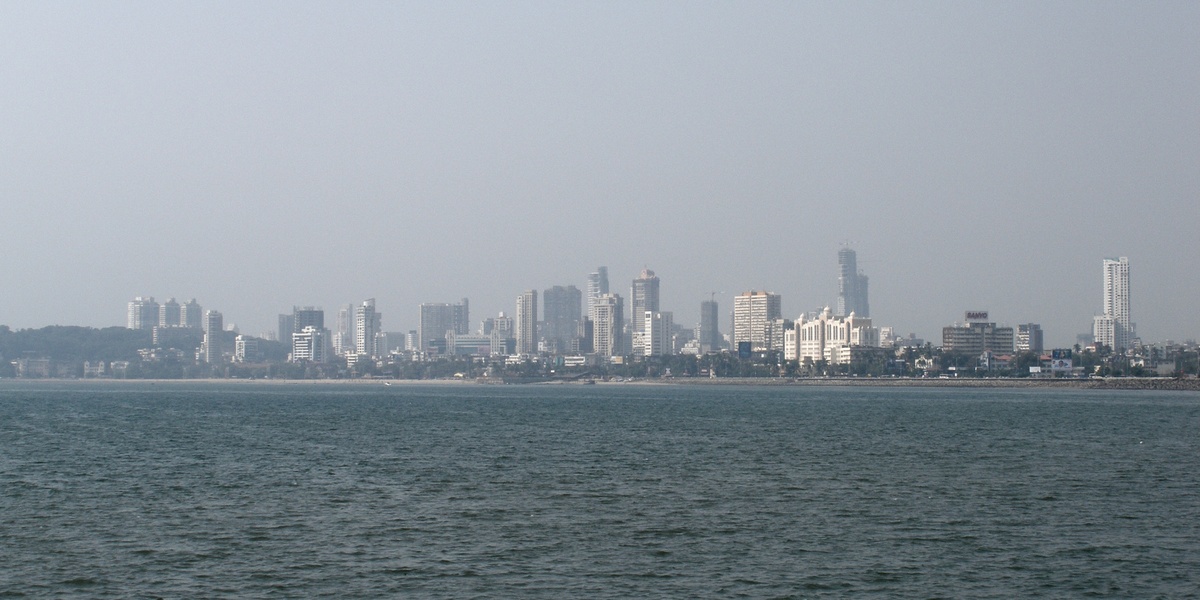
Mumbai
Financial and entertainment hub with the country’s largest metro economy (~INR 32,800bn) driven by finance, film, ports and services; massive HNWI base supports luxury markets. Growth hinges on infrastructure and congestion (Source: Oxford Economics 2023; Wealth-X 2023).
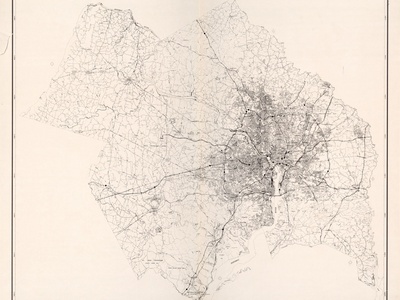
Delhi NCR
India’s political and commercial capital (NCR) with ~INR 30,340bn metro GDP, driven by services, government, real estate and tech spillover; large HNWI population and complex commuter spread. Infrastructure and policy shape growth (Source: Oxford Economics 2023; Wealth-X 2023).
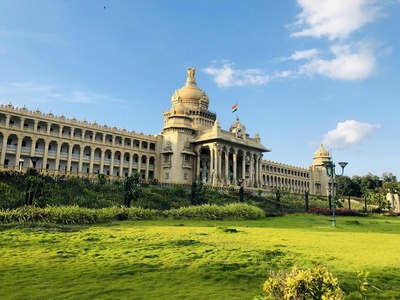
Bengaluru
Tech and startup powerhouse with ~INR 12,300bn metro GDP, led by IT, software exports and venture activity; strong HNWI growth from founders and investors. Talent inflows and real-estate pressures continue to shape expansion (Source: Oxford Economics 2023; Wealth-X 2023).
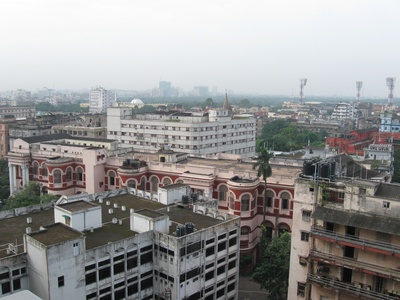
Kolkata
Historic trade and manufacturing center with ~INR 9,000bn metro GDP; major industries include ports, petrochemicals and services. Moderate HNWI concentration reflects slower catch-up versus western metros; infrastructure and policy reforms are key (Source: Oxford Economics 2023; Wealth-X 2023).
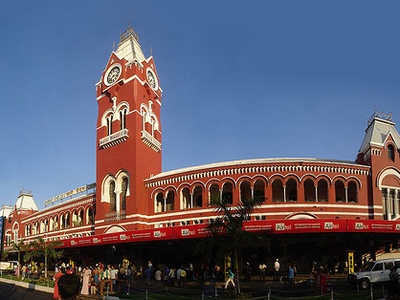
Chennai
Port, auto and manufacturing hub with ~INR 9,500bn metro GDP, anchored by auto, shipping and IT services. Rising HNWI base benefits from industry clusters and exports; coastal logistics and urban planning will influence future gains (Source: Oxford Economics 2023; Wealth-X 2023).
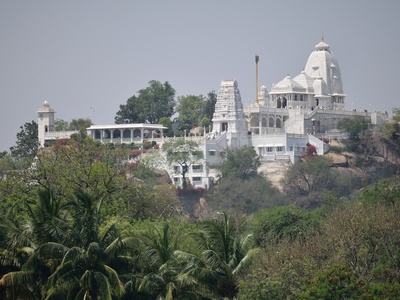
Hyderabad
Growing IT and pharmaceutical center with ~INR 8,500bn metro GDP; strengths in software services, biotech and pharma manufacturing. HNWI numbers are rising with tech exits and corporate growth; land and connectivity constraints remain (Source: Oxford Economics 2023; Wealth-X 2023).
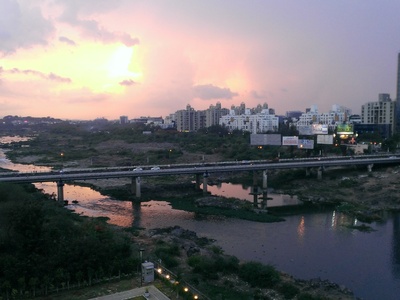
Pune
Industrial and tech-education hub with ~INR 7,380bn metro GDP, notable for auto, engineering and IT services. Skilled talent and manufacturing clusters boost wealth and HNWI growth; traffic and urban sprawl pose development challenges (Source: Oxford Economics 2023; Wealth-X 2023).
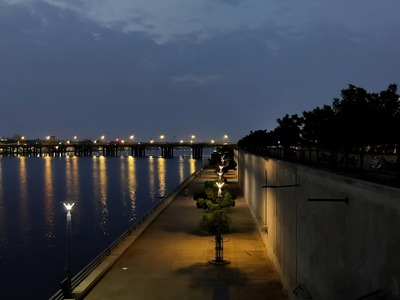
Ahmedabad
Commercial and textile center with ~INR 6,150bn metro GDP; strengths in textiles, chemicals and trade. Rising entrepreneurship and infrastructure projects drive HNWI growth, though data and metro boundaries vary across studies (Source: Oxford Economics 2023; Wealth-X 2023).
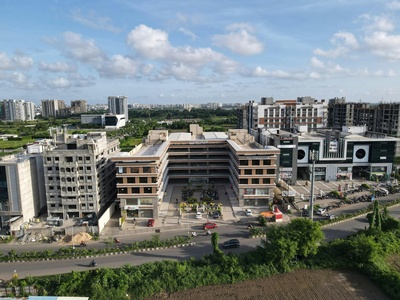
Surat
Trade, diamond and textile powerhouse with ~INR 4,920bn metro GDP; exports and manufacturing underpin wealth. Smaller HNWI base than Mumbai or Delhi but fast per-capita income growth; urban governance and pollution remain headwinds (Source: Oxford Economics 2023; Wealth-X 2023).
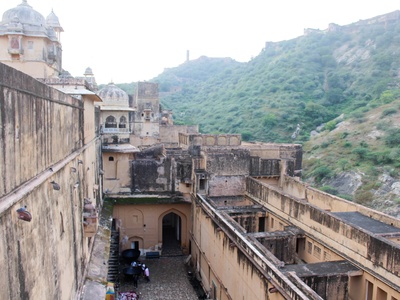
Jaipur
Tourism, manufacturing and services support a ~INR 3,690bn metro GDP; gems, textiles and growing IT/services add to wealth. HNWI counts are modest but rising with regional investment; infrastructure upgrades are critical (Source: Oxford Economics 2023; Wealth-X 2023).
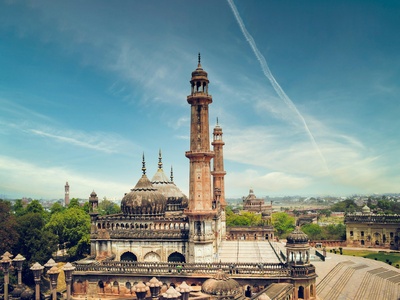
Lucknow
Administrative and services hub with ~INR 2,870bn metro GDP; public services, manufacturing and regional trade drive the economy. HNWI presence is limited but rising with urban projects and industrial estates (Source: Oxford Economics 2023; Wealth-X 2023).

Kochi
Gateway port and logistics center with ~INR 2,460bn metro GDP; shipping, tourism and petroleum related industries are key. HNWI counts are smaller but benefiting from trade and services growth; coastal risks and congestion matter (Source: Oxford Economics 2023; Wealth-X 2023).