TLDR
The 2021 census puts the UK at roughly 83.1% White, 8.6% Asian, 3.7% Black, 2.7% Mixed and 2.0% Other. Ethnic minorities make up about 19% of England, 7% of Scotland, 6.2% of Wales and 4.4% of Northern Ireland. London is the most diverse region by a wide margin.
Table of Contents
- The headline numbers
- How the census defines ethnicity
- 2011 vs 2021
- Subgroups: who sits inside each category
- Ethnic groups by nation
- Regions and cities
- Groups the census categories miss
The headline numbers
Most pages answering “what ethnicity is the UK” mix up two different figures: White British and White overall. They aren’t close. White British is the single largest group, but “White” also covers Irish, Gypsy or Irish Traveller, Roma and everyone else of white background, including the large Polish, Romanian and other European communities.
Here’s the 2021 picture for the UK as a whole:
| Group | Share of population |
|---|---|
| White (all) | 83.1% |
| Asian, Asian British or Asian Welsh | 8.6% |
| Black, Black British, Black Welsh, Caribbean or African | 3.7% |
| Mixed or multiple ethnic groups | 2.7% |
| Other ethnic group | 2.0% |
One caution for anyone citing these numbers. The UK doesn’t run a single census. The Office for National Statistics covers England and Wales, while Scotland and Northern Ireland run their own through National Records of Scotland and NISRA. Scotland’s count was delayed a year to 2022. UK-wide totals combine all three, and the category wording differs slightly between them.
How the census defines ethnicity
Ethnicity in the census is self-declared. Nobody checks your answer, and it isn’t the same as nationality, citizenship, country of birth or race. A person born in Leeds to Pakistani parents and a person who arrived from Karachi last year can both tick “Pakistani”. A Black British person and a recent arrival from Nigeria can both tick “African” or “Black British”.
In England and Wales, respondents pick from five broad groups, each with detailed tick boxes and a write-in option:
- White
- Asian or Asian British
- Black, Black British, Caribbean or African
- Mixed or multiple ethnic groups
- Other ethnic group
The question is voluntary. In 2021 it was answered by the vast majority of residents, which is why ONS treats it as reliable at national and local levels. For methods and the full tables, see the ONS ethnic group bulletin for England and Wales.
2011 vs 2021
The cleanest like-for-like comparison uses England and Wales, where both censuses ran with the same questionnaire design:
| Group | 2011 | 2021 |
|---|---|---|
| White | 86.0% | 81.7% |
| Asian | 7.5% | 9.3% |
| Black | 3.3% | 4.0% |
| Mixed | 2.2% | 2.9% |
| Other | 1.0% | 2.1% |
White British fell from 80.5% in 2011 to 74.4% in 2021. That’s still about three in four residents of England and Wales. The “Other” group more than doubled, partly because 2021 added an “Arab” tick box under Other and gave Roma their own category within White.
This is why older pages disagree with newer ones. A source quoting 87% White is using 2011 data (or UK-wide 2011 data), not a different measurement. Always check which census a number comes from.
Subgroups: who sits inside each category
The broad groups hide most of the variety. The largest detailed groups in the 2021 data are:
| Subgroup | Share of population |
|---|---|
| Indian | 2.3% |
| Pakistani | 1.9% |
| African | 1.6% |
| Caribbean | 0.9% |
| Bangladeshi | 0.7% |
| Chinese | 0.7% |
Indian is the biggest non-White group, with communities concentrated in Leicester, Birmingham, west London and Slough. Pakistani communities are strongest in Bradford, Birmingham, Manchester and parts of Lancashire. Bangladeshi residents are heavily clustered in east London, with Tower Hamlets the best-known example. African communities grew fastest of the large groups between 2011 and 2021, and Caribbean communities, many with roots in Jamaica, are older and more spread out, reflecting migration that peaked in the 1950s and 60s.
Ethnic groups by nation
The four nations look very different:
| Nation | Ethnic minority share | Census year |
|---|---|---|
| England | about 19% | 2021 |
| Scotland | about 7% | 2022 |
| Wales | 6.2% | 2021 |
| Northern Ireland | 4.4% | 2021 |
England pulls the UK average up. It holds the large majority of the UK population and almost all of its biggest minority communities. Wales is far less diverse overall, though Cardiff and Newport differ sharply from the rest of the country. Scotland’s census is run by National Records of Scotland with its own question wording, including options such as “Scottish” and “Other British” under White, so its figures can’t be lined up with England and Wales one for one.
Northern Ireland’s main census distinction isn’t ethnic at all. It’s national identity and religion background, which sit in separate questions. The ethnicity question there records a small but growing minority, with Chinese, Indian and Black African communities among the largest groups.
Regions and cities
Within England, the gap between regions is bigger than the gap between most nations.
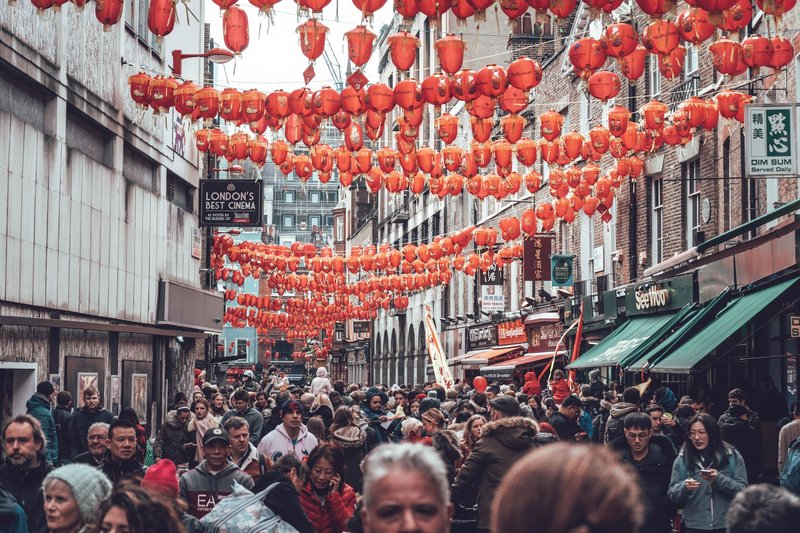
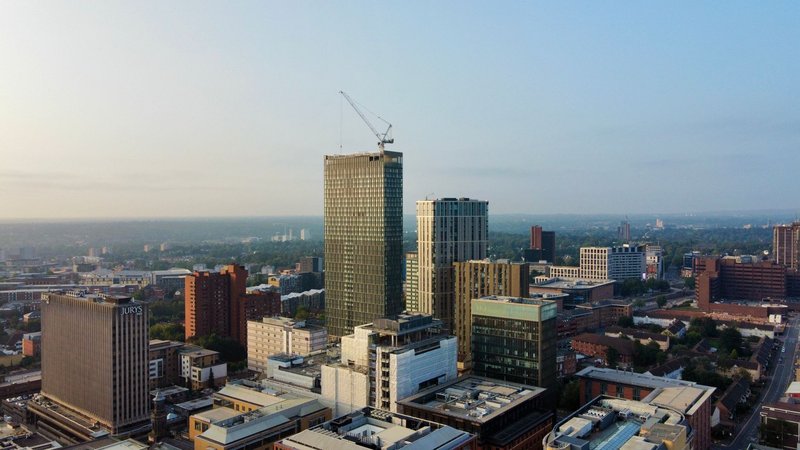
London is the standout. Roughly 54% of Londoners are White, and only about 37% are White British. Nearly one in five is Asian and about one in five is Black. No other English region comes close.
West Midlands and the East Midlands come next, driven by Birmingham, Leicester, Coventry and Wolverhampton. Leicester was one of the first British cities where White residents dropped below half the population, a milestone it passed in the 2011 census. Birmingham had around 51% White residents in 2021.
The North East and South West are the least diverse English regions, with ethnic minorities making up roughly 7% to 8% or less of residents in most local areas.
Beyond London, the most diverse local authorities include Newham, Brent, Harrow, Slough, Leicester and Luton. Rural Cornwall, Northumberland and much of Wales sit at the other end of the scale.
Groups the census categories miss
Not everyone fits a tick box. Two communities that most ranking pages skip:
Roma. The 2021 census in England and Wales introduced a dedicated Roma tick box for the first time, and just over 100,000 people used it. Roma communities include long-settled families and, increasingly, people who arrived from Romania, Slovakia and the Czech Republic.
Gypsy or Irish Traveller. A separate tick box has existed since 2011, and roughly 67,000 people ticked it in England and Wales in 2021. Specialists believe the real number is higher, since many Gypsy and Traveller people avoid official forms.
Other groups are folded into larger boxes. Jewish people are counted by ethnic category (usually White), not religion, so the ethnicity data won’t show them separately. The same applies to Sikhs, who answer the religion question separately from the ethnic one.
For ongoing figures beyond the census, the UK government’s Ethnicity facts and figures service is the best single source, covering population, health, education and employment by ethnic group.
Summary
The UK is about 83% White and 17% minority ethnic overall, but the country you’re counting in changes the answer from 4% to 19%. London alone accounts for a huge slice of that diversity. Use 2021 figures, check whether a source means White or White British, and remember that Scotland counted a year later than England and Wales. The United Kingdom’s ethnic groups aren’t a single story. They’re four censuses, a dozen cities and a lot of local history.