A recent statewide analysis showed several New York cities with violent-crime rates well above the national average — surprising given the state’s overall safety reputation. Decades of industrial decline, population loss in some older manufacturing centers, and uneven economic recovery have left concentrated poverty and housing vacancy in parts of these places, and that context helps explain why certain communities face higher rates of serious crime (see FBI/UCR and New York State Division of Criminal Justice Services for city-by-city figures).
This list ranks 12 municipalities with notable crime challenges, outlines key local drivers, and offers practical context and safety guidance for residents and visitors. The approach is data-driven: each profile gives a recent population figure (2020 census or latest estimate), a violent-crime rate per 100,000 (cited to 2021–2022 FBI/UCR or state data where available), recent trends, and at least one local response such as policing strategies, community programs, or redevelopment efforts. The full roster contains 12 entries and draws on federal and state crime reports plus local reporting and police-department releases.
Upstate Urban Centers with Elevated Crime
Several mid-sized upstate cities show higher violent-crime rates per capita than the statewide average, a pattern tied to long-term manufacturing loss, shrinking tax bases, and concentrated poverty. Violent crime and property crime often move differently: some places see more theft and auto break-ins tied to tourism or commerce, while others register elevated assaults and shootings tied to localized disputes.
Local mitigation strategies vary: federal Opportunity Zone investments and state revitalization grants have targeted downtowns, while community groups and police departments experiment with focused-deterrence, violence-interruption teams, and increased outreach. For comparison, several upstate cities report violent-crime rates in the low thousands per 100,000 residents (per 2022 FBI/UCR), above New York State’s overall rate; neighborhood-level dashboards provide the clearest picture.
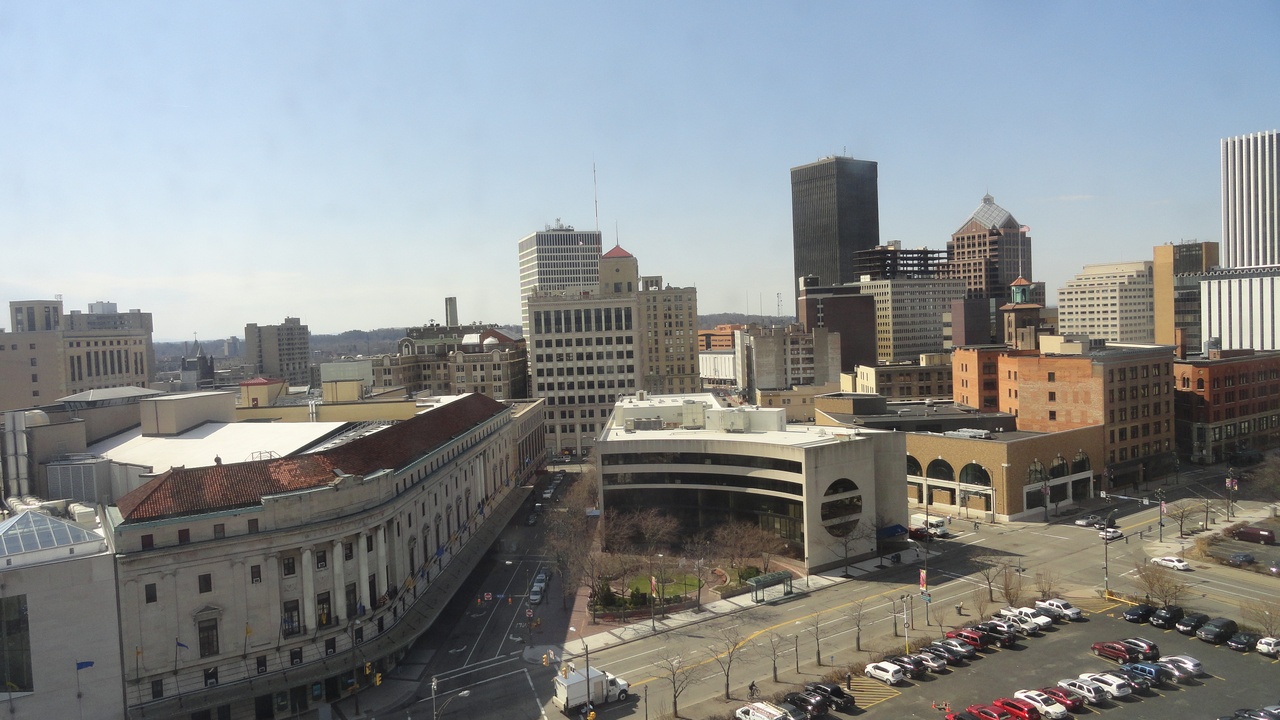
1. Rochester
Rochester ranks among the highest upstate for violent crime per capita. The city’s 2020 population was roughly 205,000 (U.S. Census), and according to 2022 FBI/UCR data Rochester’s violent-crime rate was in the high hundreds to low thousands per 100,000 residents (local reports often cite figures around 1,700–1,900/100k depending on the year and reporting method).
Trends have fluctuated year to year: after spikes in the early 2020s some indicators showed modest declines in 2023 as focused policing and community violence-intervention funding ramped up. Persistent drivers include concentrated poverty in neighborhoods such as the Northeast and 19th Ward, high vacancy rates, and limited entry-level job growth.
City responses include expanded violence-interruption programs funded by state grants and neighborhood investment initiatives tied to downtown redevelopment. Schools and small-business owners report safety concerns in certain corridors, but local partnerships between nonprofits and Rochester Police Department aim to redirect youth and stabilize hot-spot blocks.
2. Buffalo
Buffalo’s population was about 278,000 in 2020, and the city has ranked high on both violent- and property-crime measures in recent FBI/UCR summaries (2022 figures placed the violent-crime rate above the statewide average). Exact rates vary by source, but local policing data and the FBI showed a notable share of aggravated assaults and shootings in several neighborhoods in 2021–2022.
Key drivers include concentrated economic distress in parts of the East Side and opioid-related disorder that strains emergency and social services. At the same time, downtown and waterfront revival efforts have brought businesses and visitors, complicating public-safety planning during peak tourism and event periods.
Policy responses include community-policing initiatives, county-level behavioral-health collaborations, and targeted enforcement in repeat-offender corridors. Tourism stakeholders coordinate with police to increase patrols around festivals and major events to reassure visitors and local businesses.
3. Syracuse
Syracuse, which had about 148,000 residents in 2020, reports violent-crime metrics above many state peers (2022 FBI/UCR figures show elevated rates relative to New York’s median). Property-crime patterns also matter in parts of the city with high vacancy.
Contributing factors include housing deterioration, concentrated poverty in neighborhoods like the South Side, and the complex dynamics a major university brings—Syracuse University’s student population affects local housing turnover and enforcement needs seasonally.
Local measures include youth-outreach programs, focused-deterrence tactics in identified hot spots, and state-funded blight remediation. Emergency departments and police have cited strain during spikes in violence, prompting cross-agency grant applications to expand prevention work.
4. Utica
Utica’s population was about 63,000 in 2020, and the city reports a violent-crime rate that has historically placed it among the region’s more challenged small cities (local police and state summaries reference 2021–2022 rates above state averages in certain years).
Utica’s context includes economic transition from manufacturing, recent refugee-resettlement that has changed neighborhood demographics, and pockets of concentrated poverty that stress services. Those shifts can produce both opportunities and short-term tensions as communities integrate.
The city has invested in community policing changes, resettlement-support programs, and job-training partnerships with local employers to expand opportunities and reduce the conditions that sometimes feed crime. Local reporting has highlighted targeted neighborhood outreach as a priority for city leaders.
Downstate and Suburban Cities Facing Safety Challenges
Communities near New York City often wrestle with dense populations, sharp income inequality, and major transit nodes that concentrate both people and opportunity for crime. Proximity to the metro area shapes housing pressures and commuter flows, while municipal resources may lag behind demand.
Regional coordination—multi-agency task forces, shared transit policing, and county-funded social-service partnerships—has been a common local response, and some downstate rates compare differently than upstate examples when adjusted for population density and commuter inflow.
5. Yonkers
Yonkers, with about 211,000 residents (2020), reports violent- and property-crime rates that are above some suburban peers, particularly in neighborhoods near major transit corridors. Per 2022 police and state data, violent-crime figures rose in certain years though they vary by precinct.
Drivers include dense multi-family housing, economic pockets along the riverside and northwest Yonkers, and heavy commuter traffic that creates opportunities for property offenses. Local businesses and schools have noted safety concerns in specific corridors.
The city has rolled out community-police engagement initiatives and partnered with Westchester County on nuisance-property enforcement and youth employment programs aimed at preventing crime where it clusters.
6. Mount Vernon
Mount Vernon’s 2020 population was about 67,000, and it has one of the higher violent-crime rates among downstate suburbs (local police reports and county summaries noted elevated per-capita figures in recent years). The town’s small area and high density concentrate incidents.
Structural contributors include public-housing concentration, limited commercial tax base, and tight streetscapes that magnify social stressors. That density means disturbances in one block can quickly affect nearby schools and merchants.
City efforts feature after-school and summer youth programs run by nonprofits, nuisance-abatement enforcement, and recent grant-funded community centers that aim to provide alternatives for at-risk young people.
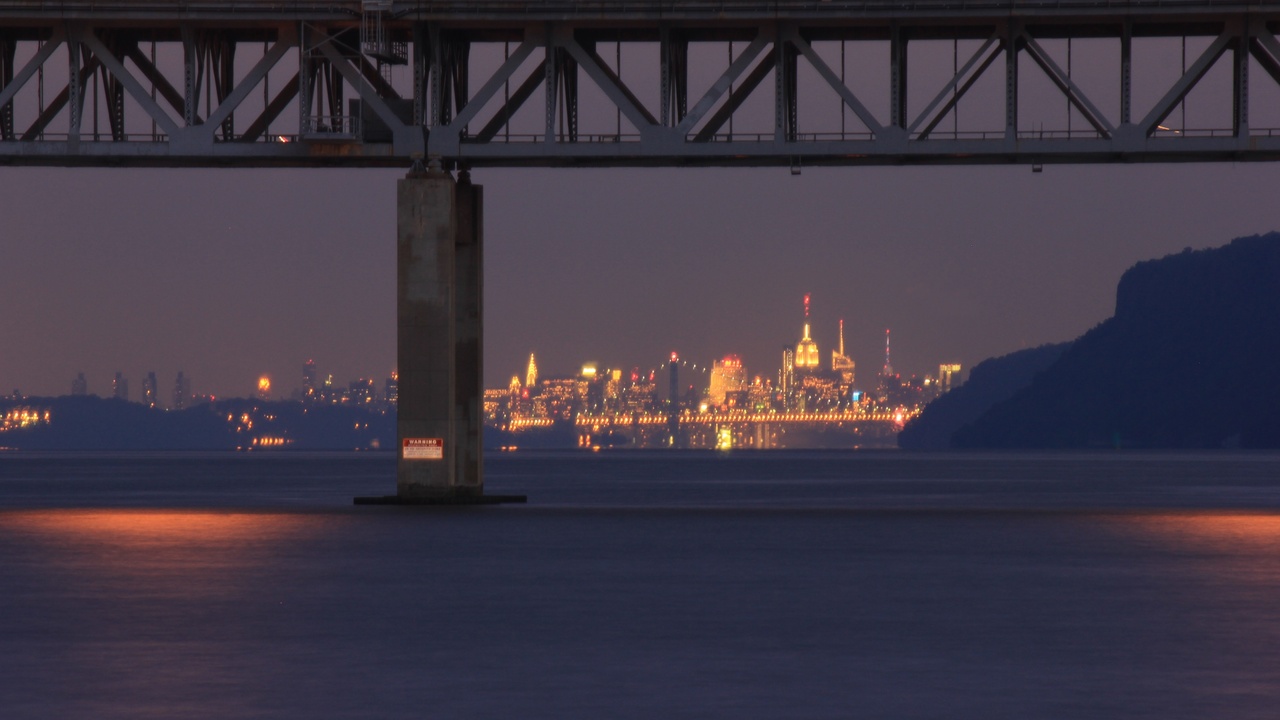
7. Newburgh
Newburgh had about 28,000 residents as of 2020 and has shown a violent-crime rate per 100,000 that places it among smaller cities with serious public-safety challenges (per 2021–2022 state and local data). The contrast between waterfront redevelopment and older disinvested neighborhoods shapes perceptions.
Gentrification and tourism along the Hudson have brought investment to parts of downtown, but persistent blight and few local job options in other blocks contribute to crime concentration. That split can make overall city statistics misleading without neighborhood context.
Municipal responses include code-enforcement campaigns, job-training partnerships, and coordinated efforts with county social services to address substance-use and housing instability—moves local leaders cite in recent news coverage as part of a multi-pronged strategy.
8. Hempstead
The incorporated Village of Hempstead (around 59,000 residents in 2020) and the broader Town share crime and governance complexity tied to Nassau County’s structure. Local and county-level policing arrangements affect response times and resource allocation, and Hempstead reports higher property- and violent-crime counts per capita in several recent years (see county crime maps for yearly figures).
Drivers include diverse socioeconomic conditions, dense housing, and competition for limited municipal resources. Schools in some neighborhoods feel the effects of neighborhood disorder, and commercial corridors report shoplifting and street-level offenses that hurt small businesses.
Responses have included county-funded school-safety measures, partnerships to expand mental-health outreach, and targeted patrols around known trouble spots—initiatives the village and county have publicized as reducing repeat incidents in certain blocks.
Post-Industrial and Tourist Towns with High Crime Rates

Smaller post-industrial cities and tourist towns often show seasonal swings in crime: summer visitors bulk up petty thefts and disorder, while the off-season exposes underlying economic fragility. Limited municipal budgets mean fewer officers and slower code-enforcement capacity, which can worsen blight.
Redevelopment can help, but it also introduces tensions—new businesses bring customers and better lighting, yet rising rents can displace residents and shift problem areas. Below are four such cities that round out the top-12 list.
9. Niagara Falls
Niagara Falls had about 48,000 residents in 2020 and records both property- and violent-crime figures that spike during peak tourism months (2022 local and FBI data show seasonal increases in thefts and aggravated assaults in tourist corridors). Yearly violent-crime rates have been above statewide medians in several recent reports.
Summer brings large crowds; petty theft, pickpocketing, and disorderly conduct rise on the boardwalk and around attractions, while economic decline in some neighborhoods fuels non-tourism-related crime the rest of the year.
Municipal responses include increased patrols and business-improvement-district efforts during peak months, plus grant-funded façade and downtown-revival projects intended to make the city safer and more welcoming for visitors and residents alike.
10. Schenectady
Schenectady’s 2020 population was about 66,000, and its violent-crime rate per 100,000 has been above some regional peers according to recent state reports (2021–2022). The city’s post-industrial history left pockets of vacancy even as downtown redevelopment around theaters and transit hubs has picked up.
Revitalization—new apartments, venues, and restaurants—has improved some corridors but also concentrated nightlife that requires targeted policing and crowd management. Commuting patterns to Albany and regional centers add to day-night population swings.
Local efforts include partnerships between downtown business groups and police, grant-supported blight-removal programs, and investment in cultural anchors that leaders say help change perceptions over time.
11. Troy
Troy, with roughly 50,000 residents in 2020, shows uneven crime statistics across neighborhoods, with violent- and property-crime rates that have been elevated compared with some nearby cities (per 2022 state summaries). Concentrated poverty and aging housing stock are recurring themes.
The city has pursued nuisance-property ordinances and a vacant-property registry to limit illegal occupancy and improve code enforcement. Those efforts aim to reduce the micro-environments where crime often proliferates.
Nonprofits and city youth-services programs also focus on employment and mentoring to address root causes; municipal leaders highlight these interventions alongside enforcement as the balanced approach Troy needs.
12. Albany
Albany’s population was about 99,000 in 2020, and the state capital reports a moderate-to-high violent-crime rate in some data sets (2022 figures show wide neighborhood variation). State-government presence and downtown nightlife both concentrate activity that affects policing priorities.
Crime statistics vary sharply by neighborhood: some blocks near the university and the Capitol are low-incidence, while other neighborhoods struggle with higher assault and theft figures. The result is a city with a complex and mixed safety profile.
Municipal policy mixes targeted enforcement in nightlife corridors with community-investment programs and anti-blight grants intended to reduce vacancy and stabilize neighborhoods across the city.
Summary
- Several of the most dangerous cities in new york share common roots: industrial job loss, concentrated poverty, housing vacancy, and municipal budget constraints that limit services and policing in hot-spot neighborhoods.
- Crime is highly neighborhood-specific; citywide averages can mask safe districts and localized trouble spots. Use local police crime maps and FBI/UCR summaries (for 2021–2022 data) to get block-level context before making housing or travel choices.
- Practical steps for residents and visitors: consult municipal crime dashboards, attend community-police meetings, support youth-employment and nuisance-property remediation programs, and maintain situational awareness—especially near transit hubs and nightlife corridors.
- Many cities are combining enforcement with investment: expanded patrols during peak tourist seasons, federal and state revitalization grants, and community-based violence-interruption programs show measurable local impact when sustained and well-funded.