Milwaukee’s violent-crime rate has long ranked well above the state average, and several smaller Wisconsin cities register per-capita crime figures that surprise visitors and residents alike. Milwaukee (2020 population 577,222) recorded a violent-crime rate of roughly 1,400 per 100,000 people in the most recent FBI UCR/NIBRS summary year cited here (2022), while several mid- and small-sized cities show far higher per-capita property-crime numbers. A city-level view matters because local policy, policing resources, tourism patterns and relocation decisions all hinge on neighborhood- and per-capita data rather than statewide totals. This ranking uses per-100,000 violent- and property-crime rates from the latest FBI UCR/NIBRS and Wisconsin DOJ city-level reports (noted by year throughout) and flags data limits where appropriate. Below are the 10 cities that stand out on those measures, organized by the dominant local pattern, followed by practical context and safety guidance for residents and visitors.
Urban centers with the highest violent-crime rates
Large urban populations often concentrate violent incidents in particular neighborhoods, so per-capita rates give a fairer comparison across cities. Drivers include concentrated poverty, gang activity, busy commercial corridors that attract illicit markets, and differences in policing resources; comparing incidents per 100,000 residents helps normalize raw counts (FBI UCR/NIBRS; Wisconsin DOJ, 2022).
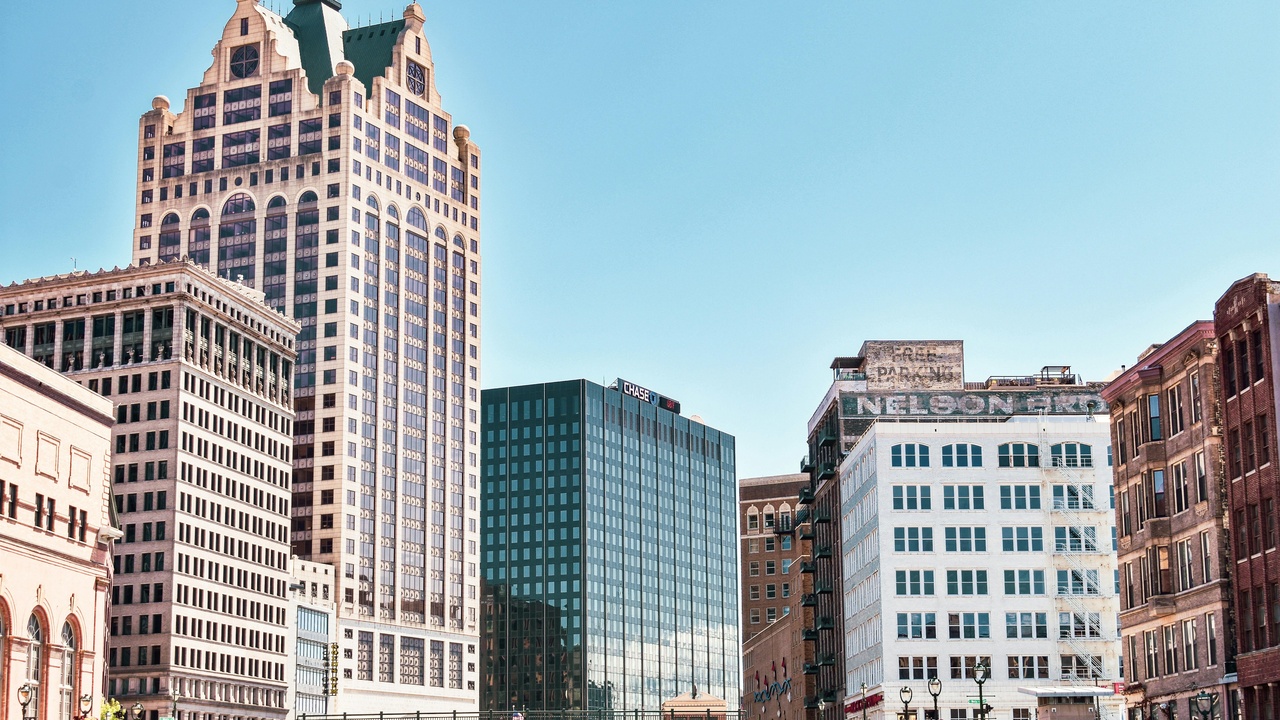
1. Milwaukee — largest city and highest violent-crime concentration
Milwaukee ranks #1 on this list by violent-crime concentration. Using FBI UCR/NIBRS and Wisconsin DOJ city figures for 2022, Milwaukee’s violent-crime rate was roughly 1,400 per 100,000 residents (2020 pop. 577,222) (FBI UCR/NIBRS, 2022; Wisconsin DOJ, 2022). Economic inequality, long-standing concentrated disadvantage on the north side, and drug-related violence are recurring contributors.
Impacts are uneven: much of downtown and the lakefront remain active during daytime and draw tourists, while specific neighborhoods report higher shootings and homicides. A spike in homicides in 2020–2021 prompted expanded focused-deterrence policing and community violence-interruption grants in 2021–2022 (Milwaukee Journal Sentinel, 2021–2022).
For residents and visitors that means using standard precautions—avoid poorly lit blocks at night, stay aware near transit hubs, and consult local crime maps for block-by-block risk rather than relying on citywide labels.
2. Racine — port city with concentrated violent incidents
Racine appears near the top by per-capita violent-crime rate; city-level data for 2022 put violent crime well above many suburbs (2020 pop. ~77,800) (Wisconsin DOJ, 2022). Economic decline in particular neighborhoods, proximity to larger metro markets, and pockets of drug-related violence drive much of the variation.
Downtown blocks and some residential neighborhoods report markedly higher incident rates than outlying suburbs, which affects commuting patterns and school safety perceptions. Local reporting documented a notable spike in shootings in 2021–2022 that prompted expanded community policing and youth-mentoring programs (Racine Journal Times, 2022).
Commuters and parents should check school- and neighborhood-level advisories and follow police suggestions for safe routes and after-dark travel.
3. Kenosha — commercial corridors and episodic violence
Kenosha ranks high on violent-crime metrics when measured per 100,000 residents (2020 pop. ~99,900); FBI and state data for 2022 show elevated violent- and property-crime rates compared with surrounding suburbs (FBI UCR/NIBRS, 2022; Wisconsin DOJ, 2022).
High-profile episodic incidents have affected year-to-year totals and public perception—most notably the 2020 police shooting that led to civil unrest and broader national attention (national press, 2020). Those events can drive policing changes and a temporary uptick in certain categories of crime.
The result: some commercial corridors and nightlife pockets see higher short-term risk; visitors should plan parking and travel routes carefully during busy evenings and monitor local advisories.
Smaller cities with high per-capita crime rates

Smaller post-industrial and manufacturing towns often post high per-capita crime rates because a handful of incidents can translate to large rates when the denominator—a small population—is low. Job losses, economic transition and concentrated pockets of poverty are common drivers (Wisconsin DOJ, 2022). Per-100,000 measures make these effects visible and comparable across places.
4. Beloit — manufacturing legacy and concentrated crime
Beloit ranks #4 by per-capita measures. The 2020 population was about 36,966, and city-level reports for 2022 show elevated property- and violent-crime rates per 100,000 compared with neighboring Rock County towns (Wisconsin DOJ, 2022).
Manufacturing decline and concentrated poverty in parts of the city contribute to the higher per-capita figures. The city reported a year-over-year rise in certain property-crime categories in 2021 that drew attention to neighborhood-block initiatives and community policing pilots (local news coverage, 2021).
Residents should note which neighborhoods have implemented block-watch programs and allow extra time for commutes that cross higher-incidence areas, especially after dark.
5. Janesville — commuter city with notable property-crime levels
Janesville’s 2020 population (~65,600) and 2022 city data show property-crime rates that push the city into the top half of per-capita rankings, even as violent-crime rates remain lower than the largest metros (Wisconsin DOJ, 2022).
As a regional commuter and retail hub, Janesville sees concentrated retail theft and vehicle break-ins around shopping corridors and commuter parking during peak periods. Local police issued advisories after a rise in shoplifting and catalytic-converter thefts reported in 2022 (local police reports, 2022).
Shoppers and workers should use well-lit parking lots, avoid leaving valuables visible in cars, and follow store guidance during peak shopping hours.
6. Wisconsin Rapids — small city, high per-capita numbers
Wisconsin Rapids posts high per-capita crime figures relative to its 2020 population (about 18,877). State and county reports for 2021–2022 show elevated property-crime rates and recurring issues tied to substance-use markets (Wisconsin DOJ; county reports, 2021–2022).
Economic shifts, seasonal workforce changes tied to timber and manufacturing, and pockets of drug activity help explain the figures. Local reporting highlighted drug-related arrests and property-crime trends in 2021 that spurred coordinated county response efforts (local press, 2021).
For residents, the implication is attention to employer shift patterns and employer-led safety programs, and for visitors an emphasis on securing belongings and following local advisories.
Northern and college-town hotspots
Border port towns and college communities can show elevated crime rates for distinct reasons: seasonal population swings, student-related nightlife incidents, and cross-border transport activity. Those patterns often produce spikes that align with academic calendars, festival seasons or shipping cycles (FBI UCR/NIBRS; campus police logs; county reports, 2021–2022).
7. Superior — port city with concentrated property crime
Superior’s small population (2020 pop. ~26,751) combined with harbor and transport activity yields per-capita property-crime numbers that are relatively high for the region (Wisconsin DOJ, 2022). Opportunistic thefts around ports and truck-stops contribute to those figures.
Neighborhoods near the waterfront and major transportation corridors report the most incidents; local law-enforcement bulletins in 2021–2022 emphasized securing cargo and commercial properties (county sheriff reports, 2021).
Visitors and truck drivers should lock vehicles, document cargo, and use secured lots where available.
8. La Crosse — college nightlife and seasonal spikes
La Crosse (2020 pop. ~51,567) shows seasonal spikes in assaults and alcohol-related incidents tied to the university calendar; per-100,000 figures during academic terms outpace summer rates in several recent years (campus police logs; Wisconsin DOJ, 2021–2022).
Campus and downtown nightlife hotspots drive much of that seasonality. University crime logs and local reporting noted higher rates of disorderly conduct and assault during the 2019–2022 academic seasons, prompting targeted late-night patrols and bar-safety campaigns (campus police, 2019–2022).
Students and visitors should travel in groups at night, use campus escort services when available, and be mindful that academic-year figures can overstate year-round risk.
9. Wausau — regional hub with mixed crime profile
Wausau (2020 pop. ~39,100) is a regional service and retail center where property-crime concentrations around shopping districts push per-capita rates higher in some years (Wisconsin DOJ; local police data, 2021–2022).
Retail theft and vehicle break-ins near major shopping centers are the most common problems; local police campaigns in 2022 emphasized deterrence during holiday shopping periods (local police advisories, 2022).
Shoppers should use monitored lots, avoid leaving valuables in vehicles, and follow retailer guidance on in-store safety during peak weekends.
Tourist and commercial hubs with seasonal spikes
Tourist seasons and large events can produce short-term upticks in thefts, assaults and disorder that affect otherwise safer cities. Per-capita measures taken across a full year can mask event-driven spikes, so event organizers and visitors should plan for higher transient risk on game days and festival weekends (local police event reports, 2019–2022).
10. Green Bay — event-driven spikes and concentrated hotspots
Green Bay, with a 2020 population near 107,395, generally records moderate year-round crime rates, but NFL games and festivals create temporary surges in theft and public-order incidents. City and stadium security data have noted higher reported thefts and disturbances on high-attendance game days in multiple seasons (stadium security briefings; local press, 2019–2022).
Event weekends concentrate crowds in downtown entertainment districts and parking areas; police departments routinely bump staffing and deploy crowd-control plans for major events (Green Bay police event statements, 2019–2022).
Attendees should use official parking, avoid leaving valuables in sight, travel in groups when possible, and follow stadium and city guidance on safe routes and designated pickup areas.
Summary
- Ranking approach: cities are compared using per-100,000 violent- and property-crime rates from the most recent FBI UCR/NIBRS and Wisconsin DOJ city reports cited in each section; per-capita figures reveal local risk more fairly than raw counts.
- Main drivers: concentrated economic disadvantage, seasonal events, student nightlife and transport/port activity explain much of the variation across these municipalities.
- Practical guidance: check block-level crime maps, use well-lit parking, secure valuables, travel in groups at night, and follow local police advisories during high-activity periods.
- Policy note: targeted community programs, event planning, and focused policing combined with economic investment have reduced incidents where sustained efforts exist; consult local DOJ and city reports to track progress.