TLDR
Palau’s population, roughly 21,900 people spread across more than 300 islands, is dominated by indigenous Palauans (a Micronesian people with Malayan and Melanesian ancestry), who make up somewhere between 69% and 73% of residents depending on which count you trust. The next-largest groups are Filipino and other Asian immigrants (drawn largely by contract labor), a small but historically important Carolinian community from the southwest islands of Hatohobei and Sonsorol, and a thin slice of Chinese, Vietnamese, and white residents. The percentages you’ll find online disagree with each other for a specific, explainable reason — covered below.
Table of Contents
- The Breakdown, at a Glance
- Palauans: The Indigenous Majority
- Carolinians: The Southwest Islanders
- Filipinos: Palau’s Largest Immigrant Community
- Chinese, Vietnamese, and Other Asian Residents
- Why the Numbers Don’t Match
- What the Ethnic Mix Means Today
The Breakdown, at a Glance
Three different official counts, three different pictures. Here’s how the U.S. government’s own reference tool has described Palau’s population across three separate editions:
| Ethnic Group | 2000 Census | 2015 Estimate | 2020 Census |
|---|---|---|---|
| Palauan | 69.9% | 72.5% | 70.6% |
| Filipino | 15.3% | 16.3% | (folded into “Asian”) |
| Chinese | 4.9% | 1.6% | (folded into “Asian”) |
| Vietnamese | — | 1.6% | (folded into “Asian”) |
| Other Asian | 2.4% | 3.4% | (folded into “Asian”) |
| Carolinian | 1.4% | 1.0% | 1.2% |
| Other Micronesian | 1.1% | 2.4% | — |
| White | 1.9% | 0.9% | — |
| Asian (combined) | — | — | 26.5% |
| Other/unspecified | 3.2% | 0.3% | 1.7% |
Source: CIA World Factbook, three separate editions.
Notice the pattern. Palauan and Carolinian numbers stay relatively stable across two decades. The Asian categories are the ones that move around, and not because the population is actually swinging that wildly year to year.
Palauans: The Indigenous Majority
Ethnic Palauans are Micronesians with Malayan and Melanesian ancestry, and they’ve anchored this archipelago for roughly 3,000 years, long before Spanish, German, Japanese, or American administrations ever showed up. Palauan society is organized around matrilineal clans, a structure that still governs land inheritance and village leadership today, which is unusual enough in the Pacific that anthropologists have written entire careers about it.
What holds the Palauan share of the population around 70% instead of shrinking further, the way indigenous populations have in Guam or Hawai’i, is largely legal architecture: Palau’s constitution restricts land ownership to Palauan citizens, which caps how much of the country outsiders can permanently put down roots in, even as they work and live there for years.
Carolinians: The Southwest Islanders
The smallest named group in every count, Carolinians rarely crack 1.5% of the total population, but they occupy a distinct place in Palau’s story. They descend from Carolinian atoll navigators, particularly from Ulithi, who settled the remote southwest islands of Hatohobei, Sonsorol, Pulo Anna, Fanna, and Merir, hundreds of miles from Palau’s main island group and closer, geographically, to the Philippines than to Koror.
Those islands never held large populations to begin with. Hatohobei’s population dropped from around 80 residents in 1962 to about 25 by the mid-2010s, as younger generations moved to Koror for schools, jobs, and hospitals. Most self-identified Carolinians in Palau today actually live on Koror, not in the southwest islands their ancestors settled, and many are trilingual in Palauan, English, and their ancestral Carolinian language. That’s the quiet demographic reality behind the 1% figure: it’s not a shrinking group so much as a relocated one.
Filipinos: Palau’s Largest Immigrant Community
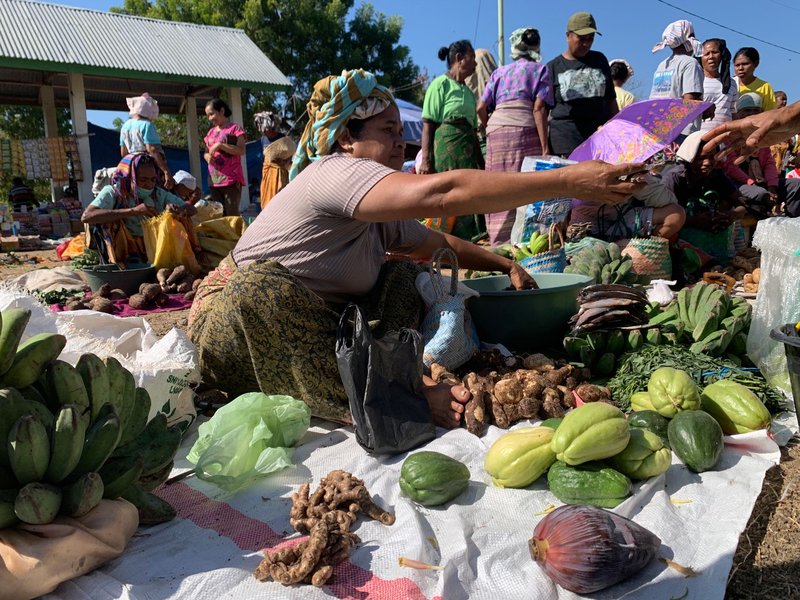
Filipino workers form the backbone of Palau’s contract labor force, concentrated in construction, hospitality, domestic work, and the tourism sector that the country’s economy leans on heavily. Academic research on this migration pattern found that of roughly six thousand non-Palauan workers, more than 75% came from the Philippines, a pattern that has held for decades under Palau’s foreign worker permit system, which ties a worker’s legal status directly to a specific employer.
That employer-tied structure is also where things get uncomfortable. Labor researchers tracking contract labor migration to Palau have documented cases where workers arrived expecting one set of conditions and found their passports held, their hours extended, and their wages withheld, with limited recourse since non-citizens have historically fallen outside Palau’s minimum wage protections. It’s a detail that rarely makes it into “culture of Palau” overviews, but it explains a lot about why the Filipino population share fluctuates: it rises and falls with labor demand and enforcement, not with births and deaths.
Chinese, Vietnamese, and Other Asian Residents
Chinese migration to Palau predates the current labor-contract era by a long way — Chinese traders and merchants were already established in Koror under German and Japanese administration in the early 20th century, running the general stores and trading posts that anchored the island’s early cash economy. The modern Chinese and Vietnamese communities are smaller and more business-oriented than the Filipino labor population, concentrated in retail, restaurants, and the fishing export trade that ships reef fish and sea cucumber to markets across East Asia.
There’s a historical layer under all of this that most demographic breakdowns skip entirely: Japan’s colonial administration of Palau between the world wars brought in so many settlers, administrators, and Okinawan and Korean laborers that by the mid-1930s, Japanese residents actually outnumbered indigenous Palauans, and by 1941 the ratio had grown to roughly four to one. Koror was nicknamed “Little Tokyo” during this period. That population evaporated almost entirely after World War II, when Japanese civilians were repatriated, which is part of why today’s ethnic breakdown reads as overwhelmingly Palauan and Filipino rather than reflecting that mid-century demographic reality at all.
Why the Numbers Don’t Match
This is the part every other page on this topic skips. Readers researching “Palau ethnic groups” run into wildly different Filipino and Chinese percentages depending on the source, and it isn’t sloppy reporting. It comes down to three separate issues stacked on top of each other:
Different years, different labor markets. The 2000 census, the 2015 estimate, and the 2020 census were taken 15 and 20 years apart. Contract labor populations move with construction booms and tourism cycles in a way permanent residents don’t, so a snapshot from 2000 and a snapshot from 2015 are genuinely describing different labor forces, not just different survey techniques.
Aggregation changes between editions. The 2015 Factbook edition itemized Filipino, Chinese, and Vietnamese as separate lines. The 2020 census, as reflected in the most recent Factbook edition, lumps them all into a single 26.5% “Asian” category. That single formatting choice is why you’ll see a specific “16% Filipino” figure on one site and no Filipino figure at all on another — both are accurate to their source, they’re just measuring at different resolutions.
Census versus estimate. A census counts people; a mid-decade “estimate” projects forward from the last census using growth assumptions. The 2015 figures are a Factbook estimate, not a fresh headcount, so where it diverges from the 2000 or 2020 census numbers, the census figures deserve more weight.
None of that makes any single source wrong. It means the honest answer to “what percentage of Palau is Filipino” is “somewhere around 15–16% as of the last two censuses, though the government’s own most recent edition doesn’t break that number out on its own anymore.”
What the Ethnic Mix Means Today
Immigration policy in Palau sits downstream of all this. The country’s Compact of Free Association with the United States lets Palauan citizens live and work in the U.S. without a visa, which pulls some of the indigenous population outward even as contract labor pulls the immigrant population inward, a two-way demographic pressure that’s fairly unusual for a country this size. Meanwhile, Palau’s government has periodically tightened work-permit enforcement and reviewed foreign investment applications specifically because the non-citizen labor population, mostly Filipino and Bangladeshi, has grown large enough relative to the citizen population to shape local politics around housing, wages, and land use.
Language tells the same story from a different angle. English and Palauan are Palau’s official languages nationwide, but Sonsorolese and Tobian (the Carolinian languages of the southwest islands) hold official status specifically in their home states, and Filipino languages, largely Tagalog and Ilocano, are common enough in Koror’s markets and job sites that they function as an unofficial third language of daily commerce. None of that shows up in a percentage table, but it’s a more honest picture of what “who lives in Palau” actually looks like day to day than any single census line can capture.