According to FBI and state crime data, several Iowa cities report violent-crime and property-crime rates well above the statewide averages—a surprising reality in a largely rural state. Iowa’s statewide violent-crime rate in 2022 was roughly 300 per 100,000 residents (FBI UCR 2022), yet many communities show much higher per-capita figures. A city-level snapshot matters because those rates influence where people choose to live, how businesses invest, and whether neighbors feel safe walking to school or the store. This piece uses FBI UCR city and state data, Iowa Department of Public Safety reports, local police dashboards, and recent reporting to rank and explain the 10 most dangerous cities in iowa by rates per 100,000 residents rather than raw counts. The list groups places into four patterns—larger urban centers, river and border hubs, smaller cities with elevated per-capita rates, and regional service centers—to make sense of trends and local responses.
Urban Centers with the Highest Violent-Crime Rates
Larger population centers often concentrate both opportunity and risk: more people, denser housing, late-night businesses, and transit corridors produce the conditions for higher per-capita violent-crime rates in specific neighborhoods. Population density, a younger demographic mix in some neighborhoods, concentrated poverty, and transit routes can each raise exposure to violent incidents. City-level FBI UCR data (2021–2022) combined with local reporting help show where rates spike and why. Officials in these urban hubs tend to combine targeted policing with community programs because the patterns are neighborhood-specific rather than citywide. Below we outline how those dynamics play out in Des Moines, Waterloo, and Cedar Rapids, using city rates per 100,000 people and 2020 census population figures to provide context.
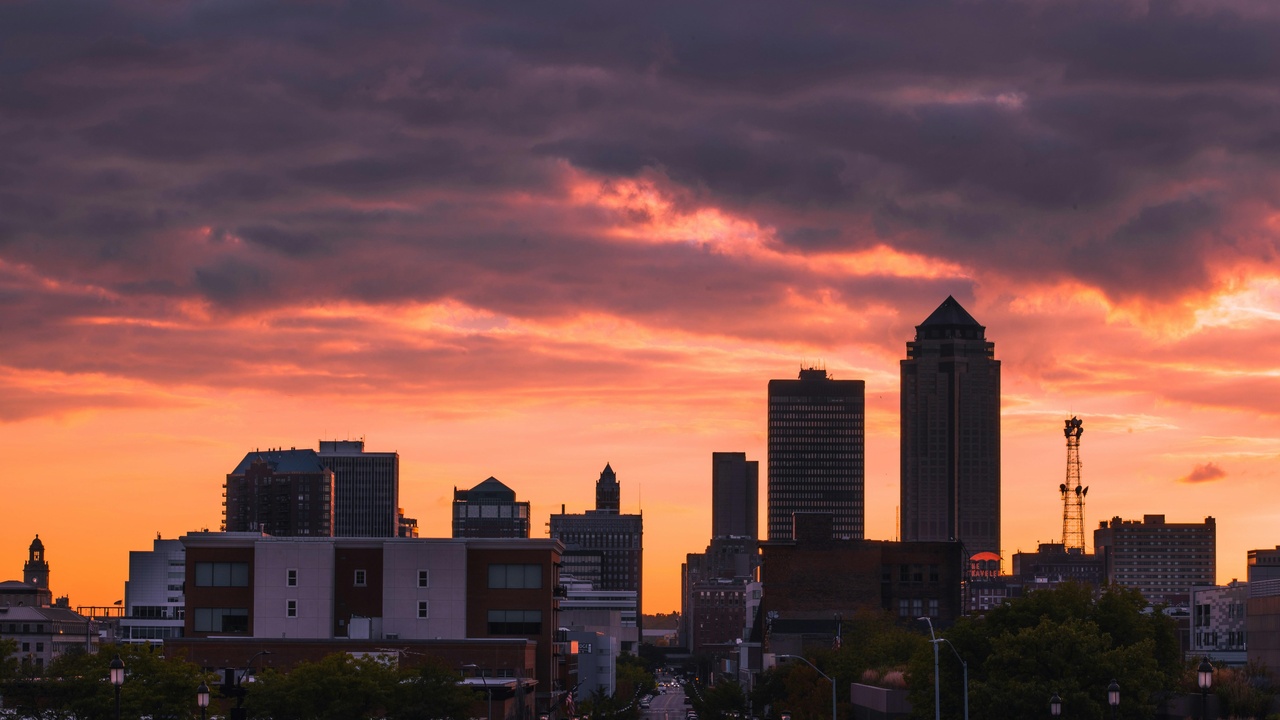
1. Des Moines — State capital and largest metro with concentrated violent crime
Des Moines ranks among Iowa’s highest in both total and per-capita violent crime in recent years. The city’s 2022 violent-crime rate was about 1,150 per 100,000 (FBI UCR 2022), while its 2020 population stood near 214,000 (U.S. Census). Those figures mask strong neighborhood variation: central and some east-side neighborhoods report far higher incident rates than suburban wards. Higher rates have influenced rental demand patterns and pushed some small businesses to invest more in security. Local reporting (for example, the Des Moines Register) has documented spikes in aggravated assaults in particular corridors and the city’s response with community-police partnerships and targeted task forces to address hotspots.
2. Waterloo — Persistent challenges with violent and property crime
Waterloo has consistently appeared near the top of state lists for violent-crime rates. FBI/DPS figures put Waterloo’s 2022 violent-crime rate near 1,300 per 100,000, with a population around 67,000 (2020 census). Trend data over the last three to five years show periods of rise and brief declines tied to enforcement sweeps and social-service interventions. Local media have highlighted clusters tied to drug markets and a handful of repeat-offender cases, prompting partnerships between the police department and community groups to bolster youth programming and violence-interruption work.
3. Cedar Rapids — Regional hub with pockets of elevated violence
Cedar Rapids serves as a regional economic center but also has identifiable crime hotspots. The city’s 2022 violent-crime rate was roughly 850 per 100,000, with a 2020 population near 137,000. Historical stressors—such as recovery from major events (including the 2008 floods) and the uneven pace of rebuilding—have shaped neighborhood vulnerability. Elevated incident rates in certain districts have influenced rental pricing and perceptions of safety. Local police have used data-driven patrols and targeted operations in hotspot areas while community organizations focus on youth employment and housing stabilization.
Border and River Hubs — Traffic, drug flows, and transit-related crime
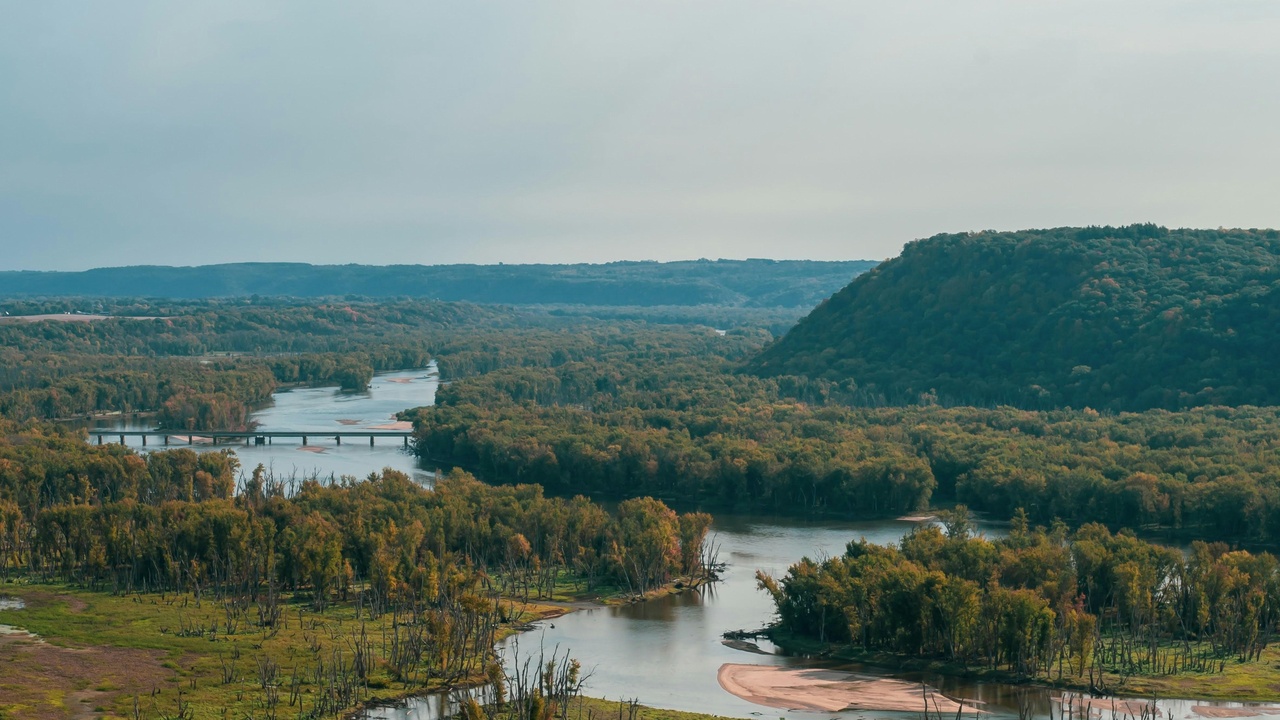
River cities and interstate hubs often show unique crime patterns tied to transport corridors, transient populations, and drug distribution routes. Towns on the Mississippi or along major interstates can experience higher rates of theft, drug distribution, and crimes of opportunity that track with truck traffic and commercial flows. Davenport, Council Bluffs, and Sioux City fit this profile in different ways: riverfront tourism in Davenport, major interstate exchanges in Council Bluffs (I‑29/I‑80), and a mix of urban and suburban dynamics in Sioux City. Law enforcement often coordinates multi-jurisdictional traffic enforcement and trafficking investigations to address these flows.
4. Davenport — Riverfront commerce and crime patterns
Davenport’s waterfront and downtown activity attract visitors but also create pockets of elevated crime. The city’s 2022 violent-crime rate was about 950 per 100,000, and its 2020 population was roughly 101,000. Higher rates of theft and drug offenses near entertainment districts have at times dented tourism and downtown foot traffic. Local reporting has documented enforcement sweeps tied to riverfront events and cooperative efforts between police and business owners to increase lighting, CCTV, and foot patrols during peak periods.
5. Council Bluffs — Interstate corridors and cross-border dynamics
Council Bluffs’ location on major interstates and its proximity to Omaha shape its crime profile. Its 2022 violent-crime rate was near 1,000 per 100,000, with a 2020 population around 62,000. Transit-corridor dynamics mean neighborhoods near interstate exits can see concentrated property and drug offenses. The city frequently works with Omaha-area agencies and Iowa DOT traffic enforcement on multi-jurisdiction operations to disrupt stolen-goods and trafficking networks that exploit cross-border flows.
6. Sioux City — Regional hub with mixed urban-suburban patterns
Sioux City combines urban cores and sprawling suburbs, producing mixed crime patterns. The city’s 2022 violent-crime rate was approximately 900 per 100,000, with a 2020 population near 82,000. Year-to-year trends show spikes linked to specific incidents and then declines after focused enforcement. Local business groups have reported concerns about commuter safety during evening hours, and police have increased targeted patrols in commercial corridors while expanding community outreach programs.
Smaller Cities with Elevated Rates — Where per-capita metrics tell a different story
Smaller cities can show high per-capita violent-crime rates even when their total number of incidents is modest. Per-100,000 comparisons are useful for that reason: a dozen incidents in a town of 10,000 produces a higher rate than the same dozen incidents in a city of 100,000. Local economic decline, closures of major employers, and limited policing capacity often drive elevated per-capita metrics. Below we look at Clinton and Fort Dodge as examples of how small-city dynamics and resource limits shape public-safety patterns.
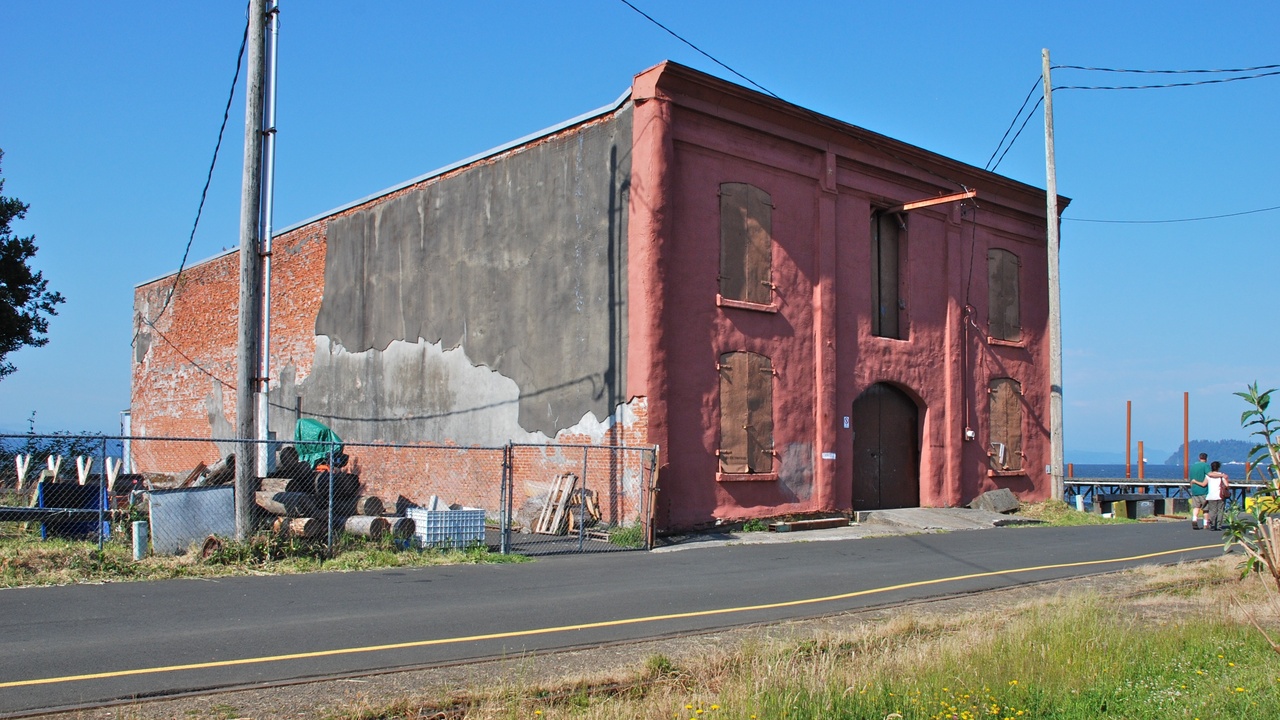
7. Clinton — River town with industrial decline and crime concentration
Clinton’s per-capita violent-crime rate has been high relative to the state; 2022 figures put it near 1,250 per 100,000, while the 2020 population was about 25,000. The city has experienced industrial decline over recent decades, and the loss of large manufacturing jobs has contributed to higher unemployment and concentrated social stress in certain neighborhoods. Local reporting has highlighted clusters of incidents near aging housing stock and calls for expanded youth programming. Municipal responses have included targeted grants for job training and partnerships with non-profits to support at-risk youth.
8. Fort Dodge — Policing strain and localized hotspots
Fort Dodge shows elevated per-capita violent-crime numbers compared with surrounding counties; 2022 data indicate a rate near 1,100 per 100,000 with a population around 25,000 (2020 census). Local police departments in smaller cities can be strained when addressing multiple hotspots, and that strain affects downtown revitalization efforts. Recent local coverage noted a concentrated series of incidents that prompted a joint police-community safety campaign and increased patrols in nightlife areas.
Regional Hubs Facing Persistent Issues — Long-term patterns and policy responses
Some mid-size regional hubs show persistent crime challenges tied to structural factors: aging housing, limited social services, and intermittent policing resources. Long-term policy responses here include state grants for housing, expanded mental-health services, and regional policing coordination. Mason City and Burlington are examples where multi-year trends highlight structural drivers and the need for sustained interventions rather than one-off enforcement campaigns.
9. Mason City — Regional services center with concentrated risk areas
Mason City functions as a service hub for a larger rural area, and its crime profile reflects that role. The city’s 2022 violent-crime rate was about 1,050 per 100,000, with a 2020 population near 27,000. Access to mental-health services and shelters—or the lack of it—intersects with public-safety outcomes. State and county programs have provided targeted funding for behavioral-health responses and diversion programs aimed at reducing repeat interactions with law enforcement.
10. Burlington — Riverfront hub with economic and safety challenges
Burlington’s riverfront position makes it a regional draw, but economic shifts and aging infrastructure have contributed to safety challenges. Burlington’s 2022 violent-crime rate was near 1,200 per 100,000, and its 2020 population was about 25,000. Those per-capita figures have affected tourism confidence and local business decisions. Local officials have sought grant-funded improvements to lighting, CCTV, and community outreach programs to make the riverfront and downtown areas safer and more inviting.
Summary
Per-capita rates change the way we read crime data: a small city with a few concentrated incidents can show a higher violent-crime rate than a larger city with more total incidents. Across Iowa, multiple structural factors—economic shifts, transit corridors, limited social services, and neighborhood-level poverty—help explain why some cities register higher rates than the state average (about 300 per 100,000 in 2022, FBI UCR 2022). The 10 communities profiled above illustrate four patterns: urban centers with concentrated hotspots, river and border hubs shaped by transport, smaller cities where per-100k math matters, and regional hubs facing long-term structural challenges. Practical interventions that appear most promising combine targeted law enforcement, expanded mental-health and youth services, and sustained economic supports for neighborhoods.
- Per-capita rates matter: compare incidents per 100,000 rather than raw counts to understand local risk.
- Economic and structural drivers—job losses, transit corridors, and service gaps—explain many local differences.
- Data sources to watch: FBI UCR (2022), Iowa DPS dashboards, and local police reports for the latest city-level numbers.
- Local solutions work best when they pair targeted policing with social services and community-led programs.
If you want to compare the most dangerous cities in iowa for a particular neighborhood, check the FBI UCR city tables and local police dashboards, and consider supporting community safety programs that focus on prevention as well as enforcement.