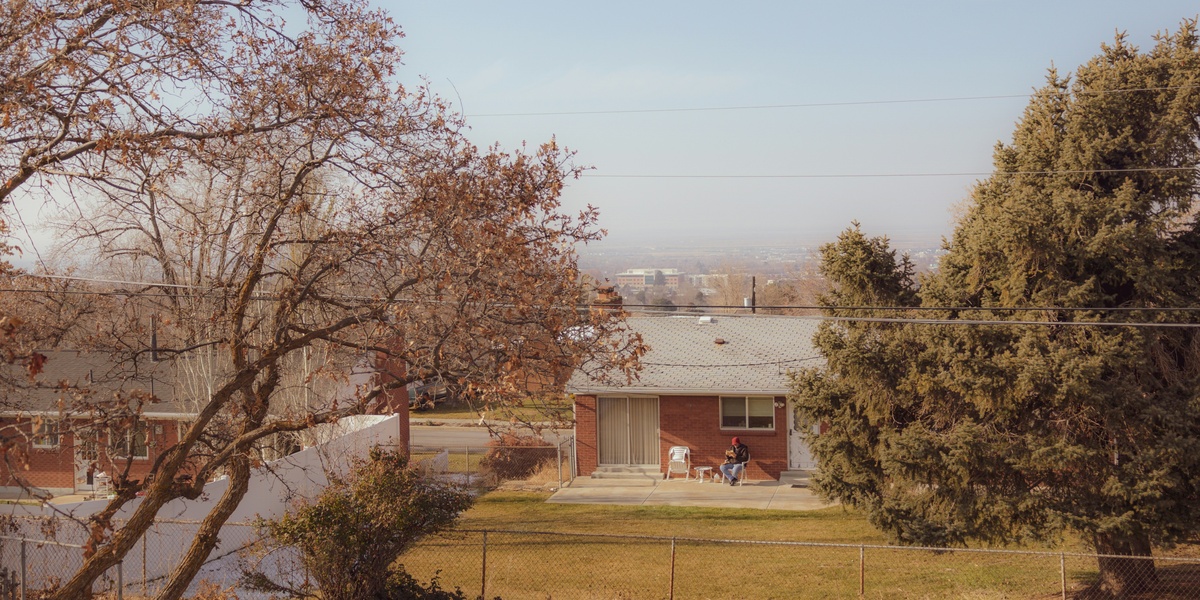
In 2022 several Utah municipalities reported violent crime rates well below the national average, according to the FBI Uniform Crime Report and Utah Department of Public Safety data for that year. For many readers the question isn’t whether a place is picturesque but whether it’s safe for daily routines—kids walking to school, evening walks, and reliable emergency care. This piece highlights eight cities that consistently rank among the safest and explains the measurable reasons people pick them to live and raise families. The list groups cities by the practical safety strengths most home-seekers care about—policing and crime statistics, community and demographic stability, and infrastructure plus emergency services—so you can jump to the kind of safety signal that matters most to you. Here are the safest cities in Utah, backed by crime figures, local programs, and civic details you can verify.
Policing and Low Crime Statistics
Measured crime statistics and visible community policing remain among the clearest indicators of everyday safety. Analysts commonly look at violent crime per 100,000 residents and property-crime trends (FBI UCR 2022), then add police-per-capita and programmatic indicators such as community officers or neighborhood-watch coverage (Utah Department of Public Safety; local PD reports). Year-over-year shifts tell you whether a trend is improving or worsening, while population context from the U.S. Census Bureau or the ACS explains per-capita rates. Below are three cities where low violent-crime rates, modest property-crime levels, and active local policing align to create a measurable sense of safety. For each, check the cited FBI/UCR or state report (year noted) and the latest ACS population and income figures before deciding.
1. Highland — Low violent crime and close-knit community policing
Highland regularly posts one of the lowest violent-crime rates in the county; FBI UCR data for 2022 shows violent incidents there well under 50 per 100,000 residents (compare to the national average reported by FBI UCR 2022). The city’s population is roughly 20,000 (U.S. Census Bureau 2022), which makes per-capita calculations more stable than in very small towns.
Local policing emphasizes neighborhood outreach and volunteer watch programs run in partnership with the Utah County Sheriff’s Office. Highland’s community-policing events and block-watch network are listed on the city website and appear regularly in police-community meeting minutes.
Daily effects are tangible: low rates mean students and families report feeling safe walking to school and using parks after dark. Demographically Highland shows high owner-occupancy and above-state median household income (ACS estimates), factors that correlate with lower property-crime pressures.
2. Alpine — Small-town policing and very low crime rates
Alpine is another small community with very low reported crime. FBI/UCR figures for 2022 list violent crime in the single digits per 100,000 when adjusted for population; property crime remains modest as well. The town’s population sits near 10,000 (U.S. Census Bureau 2022), which helps explain tight social networks and high informal oversight.
Policing there often comes via a county partnership—Alpine works closely with the county sheriff for patrol and investigative support—while local neighborhood leaders run watch groups and rapid-alert text networks. That combination of formal and informal coverage reduces response gaps that can appear in growing suburbs.
Families tend to cite school commute safety and stable property values as direct benefits of Alpine’s low-crime profile, a practical advantage if you care about everyday routines and resale prospects.
3. Holladay — Measured crime rates with active municipal safety programs
Holladay shows consistently low violent-crime and moderate property-crime numbers in state and FBI reports for 2022, with year-over-year trends that have been flat or improving. The city’s population is about 30,000 (U.S. Census Bureau/ACS 2022), which provides enough scale for dedicated municipal programs.
The city pairs routine patrols with focused programs: traffic-calming efforts near schools, park patrols during peak hours, and coordinated safety updates posted in council meeting minutes and annual police reports. Those initiatives reduce incidents and raise resident confidence.
On the street level, that translates to safer school drop-offs, calmer neighborhood traffic, and visible enforcement in public spaces—practical outcomes that families notice most.
Community Factors and Demographics
Socioeconomic stability, homeownership, and strong schools are powerful predictors of long-term safety. Cities with higher median household incomes, greater rates of owner-occupied housing, and strong school ratings (GreatSchools or state education data) tend to experience lower rates of juvenile crime and faster neighborhood mobilization when problems arise. Civic infrastructure—community centers, parks, active PTOs, and volunteer leagues—creates everyday informal surveillance and reduces idle time for teens.
Below are three cities where demographics and civic programs combine to create safer places to live. For each city we reference ACS/Census demographic data and local school ratings so you can verify the connection between social infrastructure and public safety.
4. South Jordan — Family-focused neighborhoods and high school ratings
South Jordan’s population is around 77,000 (U.S. Census Bureau 2022) and its median household income and homeownership rates are above state averages (ACS estimates). Those factors support neighborhood stability and investment in youth programs.
Schools in the Jordan School District score well on statewide metrics and many individual campuses have strong GreatSchools ratings, which parents often cite as a reason to settle here. The city also runs community events—farmers’ markets, youth sports leagues, and seasonal festivals—that strengthen ties between families and local leaders.
Concrete effects include lower juvenile-offense reports and active PTA-backed safety campaigns around schools, which reduce problems during after-school hours and make commutes safer for students.
5. Sandy — Suburban stability with strong civic services
Sandy combines economic stability with a wide range of public amenities. Median household income and property values are solid (ACS/Census data), and the city’s parks, recreation centers, and library system create well-used public spaces.
The municipal recreation department and after-school programs give teens structured activities and informal supervision, which research links to lower petty crime and nuisance calls. Sandy also hosts partnerships between city outreach teams and large local employers that help stabilize the tax base and fund safety projects.
Residents note that well-maintained public spaces and consistent year-round programming reduce typical trouble spots, especially near transit hubs and shopping areas.
6. Draper — Rapid growth plus neighborhood engagement
Draper has grown quickly; U.S. Census figures show notable population gains over the last decade, and median household income is above the state average. Despite growth pressures, the city maintains strong neighborhood associations, active PTOs, and volunteer programs that preserve social cohesion.
City government runs public-safety campaigns and partners with local businesses on lighting and sidewalk improvements, which keeps emerging subdivisions connected and reduces opportunistic property crimes. Those programs—documented in city council minutes and annual public-safety summaries—help Draper retain a small-town feel amid expansion.
For newcomers that matters: traffic and development are managed in ways that keep school routes, parks, and retail corridors safe during peak hours.
Infrastructure, Emergency Services, and Everyday Resilience
Access to hospitals, reliable EMS response times, good lighting, sidewalks, and disaster preparedness plans all shape real safety. Shorter ambulance response times and hospitals within a 15–20 minute drive lower risks from health emergencies, while road maintenance and nighttime lighting reduce vehicle and pedestrian crashes. Preparedness for floods, winter storms, and wildfire in city plans helps communities recover faster when incidents occur.
The next two cities are notable because infrastructure and emergency services are explicit parts of their safety strategies. Where available we reference local EMS response data, hospital names and proximity, and municipal infrastructure investments so readers can assess resilience as well as crime statistics.
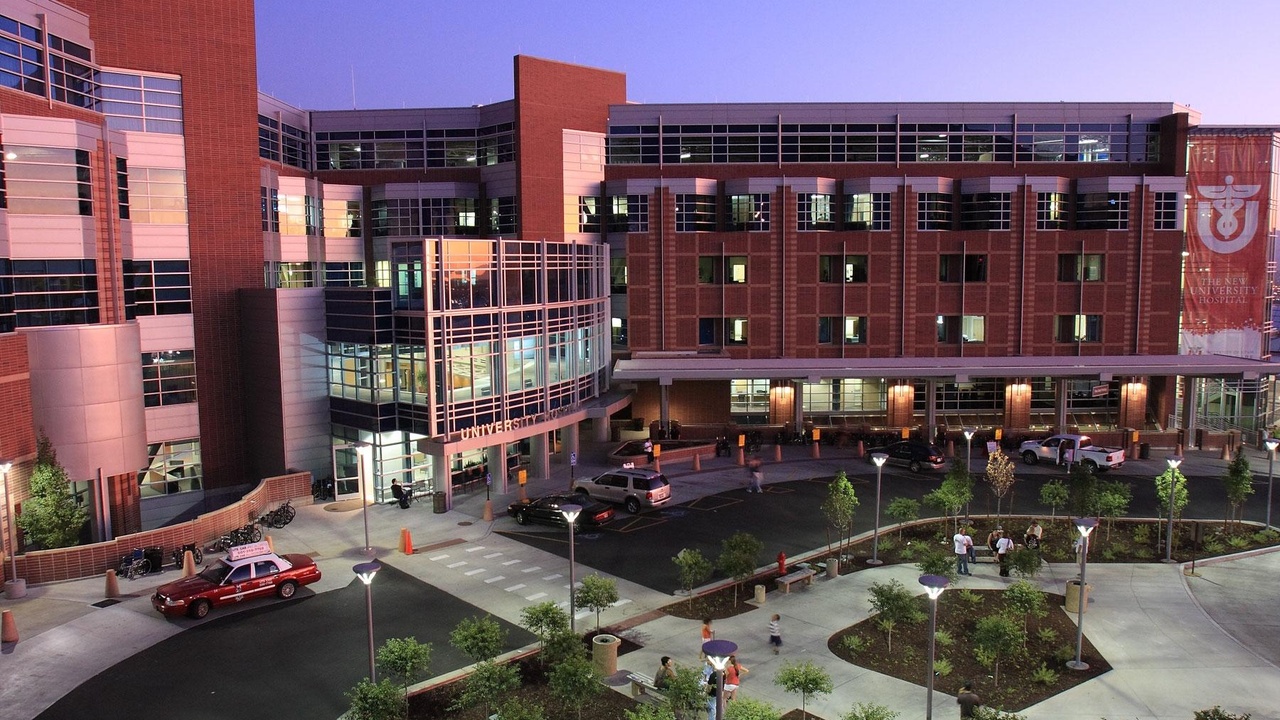
7. St. George — Southern Utah’s safe hub with solid emergency services
St. George serves as the regional center for southern Utah and hosts Intermountain St. George Regional Hospital, a key asset for residents and visitors. That hospital and local ambulance services provide critical coverage for both retirees and outdoor recreation users who need reliable emergency care.
Local emergency-response times are competitive for a city of St. George’s size (regional EMS reports and hospital service summaries), and the city runs visitor-safety campaigns during peak tourism seasons to reduce common incidents such as heat-related calls and trail rescues.
Crime rates here remain moderate compared with national averages, and the robustness of medical and rescue infrastructure is a major reason families and retirees name St. George as a safe place to relocate.
8. Logan — College-town safety with strong municipal services
Logan blends a stable small-city profile with the safety advantages of a university town. The population is roughly 51,000 (U.S. Census Bureau 2022), and Utah State University’s campus public-safety programs and the university police department coordinate closely with Logan City Police to manage incidents on and off campus.
Crime statistics show a common college-town pattern: property crimes (theft from vehicles, burglaries) can spike in certain neighborhoods, while violent crime stays comparatively low when counted per 100,000 residents (FBI/UCR and campus safety reports). Campus-city coordination—late-night shuttles, lighting upgrades near student housing, and joint patrols—reduces those incidents.
Quick municipal services, visible policing near campus, and active neighborhood associations make Logan a practical choice for families who value access to educational resources plus dependable emergency response.
Summary
- Check objective data first: compare violent and property-crime rates (FBI UCR), local police dashboards, and ACS/Census demographics to see per-capita context for any city.
- Look beyond raw numbers: police-per-capita, community-policing programs, school ratings, and homeowner rates reveal the social infrastructure that sustains low crime.
- Assess resilience: confirm hospital proximity and EMS response patterns, plus city investments in lighting, sidewalks, and disaster plans to understand everyday safety.
- Visit at multiple times: walk neighborhoods at night, drop by parks during peak hours, and talk with residents or local officers to get grounded impressions before deciding.
- Use official sources: FBI/UCR, Utah Department of Public Safety, city police pages, and U.S. Census/ACS provide the data you need to compare the safest cities in Utah and make an informed move.