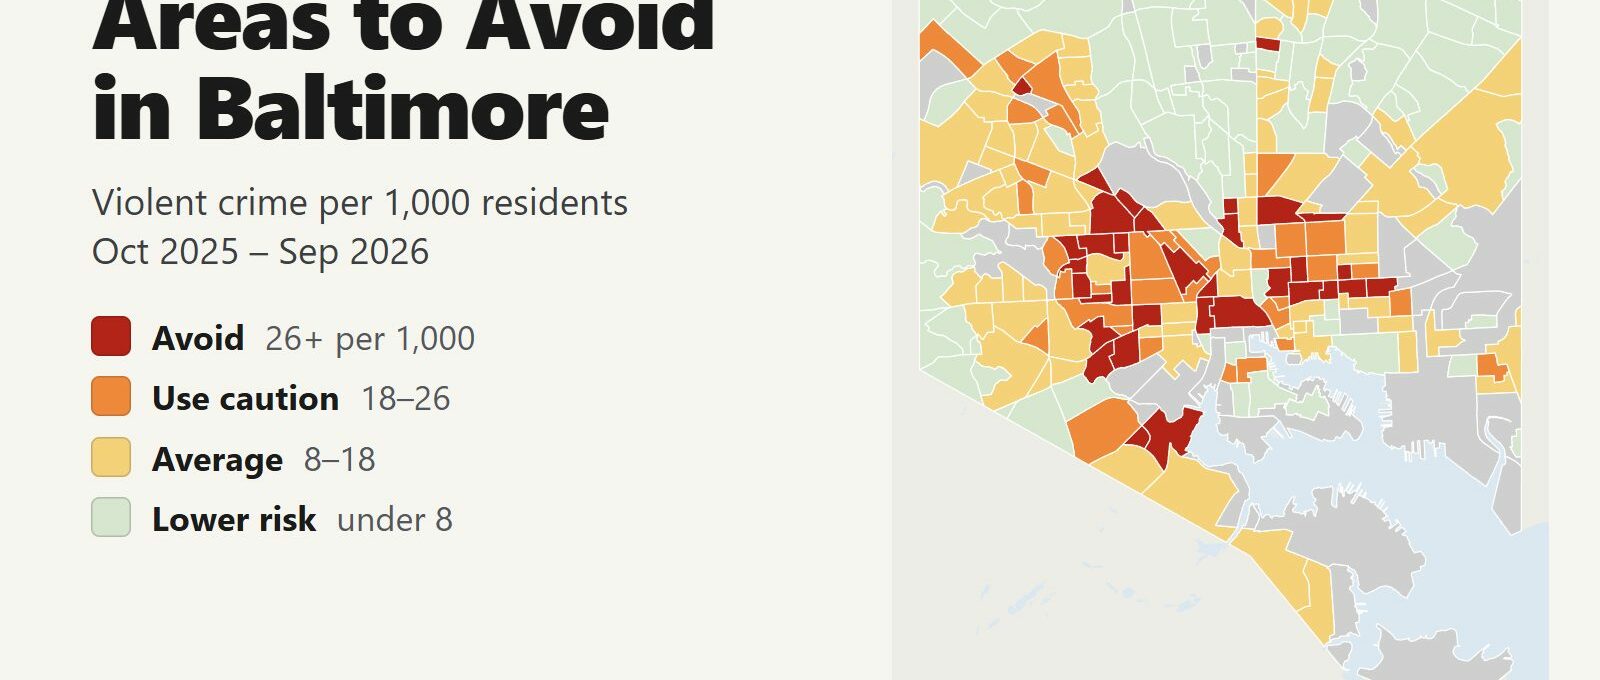
The areas to avoid in Baltimore are the rowhouse neighborhoods of West Baltimore around Penn North, Upton and Mondawmin and the blocks of East Baltimore between Oldtown and Ellwood Park. A third cluster is in Southwest Baltimore around Carrollton Ridge. Between October 2025 and September 2026, 34 of the city’s neighborhoods recorded 26 or more violent crimes per 1,000 residents, double the city average of 12.9. Those 34 neighborhoods are home to 10% of Baltimore’s residents and account for 29% of its violent crime, 31% of its homicides and 36% of its shooting victims.
Areas to avoid: Penn North, Upton, Mondawmin, Liberty Square, Mosher, Winchester, Easterwood, Midtown-Edmondson, Auchentoroly-Parkwood, Coppin Heights/Ash-Co-East, Rosemont Homeowners/Tenants, Northwest Community Action and Langston Hughes in West and Northwest Baltimore. Carrollton Ridge, Millhill, Shipley Hill, Franklin Square, Westport and Mount Winans in Southwest and South Baltimore. Oldtown, Gay Street, Dunbar-Broadway, CARE, McElderry Park, Ellwood Park/Monument, Milton-Montford, East Baltimore Midway and South Clifton Park in East Baltimore. Charles North, Old Goucher and Woodbourne-McCabe north of downtown. Downtown, Seton Hill and University of Maryland in the city center.
The Inner Harbor, Fells Point, Canton, Federal Hill, Locust Point, Mount Vernon and Hampden are where most visitors spend their time, and none of them is on the avoid list. Downtown is on the list at 55.4 per 1,000. It has 7,171 residents and a far larger daytime crowd, and its 397 violent crimes are concentrated on a few blocks around Lexington Market, Howard Street and The Block. Baltimore’s homicides have fallen every year since 2022: the department recorded 323 that year, 136 in 2025 and 121 in the 12 months to September 2026.
Baltimore safety map
Red areas are the ones to avoid and orange areas call for caution. Grey areas have fewer than 500 residents: parks, industrial land, the port, the Inner Harbor and the stadiums. Use the Northwest, Northeast, Southwest, Southeast and Downtown buttons to zoom in, and switch the map to Theft & robbery to see where shoplifting, pickpocketing and car break-ins happen. Tap or hover over a neighborhood for its numbers.
Violent crimes per 1,000 residents
Thefts & robberies per area
Tap or hover a neighborhood to see its numbers.
Table of Contents
- Areas to avoid in Baltimore
- Areas to be careful in
- Is the Inner Harbor safe?
- Is Fells Point safe?
- Is Federal Hill safe?
- Penn Station, the Light Rail and the Metro
- Safest neighborhoods to stay in Baltimore
- Is Baltimore getting safer?
- Baltimore County and the rest of the region
- Baltimore safety tips for visitors
- How this map was made
- FAQ
Areas to avoid in Baltimore
These are the 34 neighborhoods with at least double the city’s violent crime rate. Baltimore has 279 official neighborhoods with a median of about 1,300 residents, so a single corner can move a neighborhood’s rate. In several of them the violence is concentrated on a few commercial blocks and transit stops, as in Penn North and Mondawmin. Apart from Downtown and the hospital and university campuses, they are residential neighborhoods.
| Neighborhood | District | Violent crimes per 1,000 | vs. city avg | Homicides | Shooting victims | Thefts + robberies |
|---|---|---|---|---|---|---|
| Dunbar-BroadwaySoutheastern | Southeastern | 98.8 | 7.6x | 0 | 8 | 60 |
| Penn NorthWestern | Western | 62.0 | 4.8x | 1 | 4 | 105 |
| Charles NorthEastern | Eastern | 59.0 | 4.6x | 0 | 6 | 115 |
| DowntownCentral | Central | 55.4 | 4.3x | 4 | 13 | 810 |
| Liberty SquareNorthern | Northern | 51.7 | 4.0x | 1 | 4 | 48 |
| Carrollton RidgeSouthwestern | Southwestern | 48.7 | 3.8x | 3 | 8 | 114 |
| South Clifton ParkEastern | Eastern | 40.6 | 3.1x | 0 | 1 | 31 |
| Gay StreetCentral | Central | 39.9 | 3.1x | 4 | 5 | 124 |
| Ellwood Park/MonumentSoutheastern | Southeastern | 37.0 | 2.9x | 0 | 4 | 146 |
| OldtownCentral | Central | 36.3 | 2.8x | 1 | 2 | 93 |
| UptonWestern | Western | 36.1 | 2.8x | 2 | 12 | 154 |
| Midtown-EdmondsonWestern | Western | 35.6 | 2.8x | 0 | 2 | 41 |
| MondawminWestern | Western | 35.5 | 2.8x | 1 | 6 | 150 |
| MosherWestern | Western | 34.5 | 2.7x | 2 | 5 | 32 |
| Northwest Community ActionNorthwestern | Northwestern | 33.4 | 2.6x | 1 | 6 | 49 |
| Seton HillCentral | Central | 32.8 | 2.5x | 1 | 2 | 58 |
| MillhillSouthwestern | Southwestern | 32.1 | 2.5x | 1 | 1 | 102 |
| WinchesterWestern | Western | 31.5 | 2.4x | 0 | 1 | 36 |
| Auchentoroly-ParkwoodWestern | Western | 31.3 | 2.4x | 0 | 3 | 51 |
| Rosemont Homeowners/TenantsWestern | Western | 30.6 | 2.4x | 0 | 0 | 35 |
| WestportSouthern | Southern | 30.3 | 2.3x | 2 | 8 | 52 |
| University of MarylandCentral | Central | 29.9 | 2.3x | 0 | 1 | 62 |
| Franklin SquareSouthwestern | Southwestern | 29.8 | 2.3x | 3 | 8 | 86 |
| EasterwoodWestern | Western | 29.7 | 2.3x | 1 | 3 | 31 |
| East Baltimore MidwayEastern | Eastern | 28.9 | 2.2x | 2 | 4 | 88 |
| Coppin Heights/Ash-Co-EastWestern | Western | 28.7 | 2.2x | 0 | 1 | 51 |
| Milton-MontfordSoutheastern | Southeastern | 28.5 | 2.2x | 2 | 4 | 45 |
| Shipley HillSouthwestern | Southwestern | 28.5 | 2.2x | 1 | 2 | 55 |
| Woodbourne-McCabeNorthern | Northern | 28.3 | 2.2x | 2 | 4 | 25 |
| CARESoutheastern | Southeastern | 28.1 | 2.2x | 0 | 2 | 155 |
| Mount WinansSouthern | Southern | 27.6 | 2.1x | 0 | 6 | 10 |
| McElderry ParkSoutheastern | Southeastern | 27.4 | 2.1x | 2 | 5 | 152 |
| Langston HughesNorthwestern | Northwestern | 27.0 | 2.1x | 0 | 3 | 33 |
| Old GoucherEastern | Eastern | 26.8 | 2.1x | 0 | 0 | 149 |
West Baltimore: Penn North, Upton and Mondawmin
The Western District has the highest violent crime rate of Baltimore’s nine police districts after the Central District: 24.5 per 1,000 residents, almost twice the city average. It holds 10 of the 34 avoid neighborhoods. Penn North has the second-highest rate in the city at 62.0, 4.8 times the average. 41 of its 100 violent crimes were on the four blocks of North Avenue and Pennsylvania Avenue around the Penn-North Metro station.
Upton (36.1) recorded 12 shooting victims, the second-most of any neighborhood. Historic Pennsylvania Avenue runs through it. Mondawmin (35.5) and Liberty Square (51.7) meet at Mondawmin Mall and its Metro station. Sandtown-Winchester, the largest neighborhood in the district with 6,162 residents, rates caution at 22.4 and recorded 138 violent crimes. Mosher, Winchester, Easterwood, Midtown-Edmondson and Rosemont Homeowners/Tenants form a second cluster further west, between North Avenue and Edmondson Avenue.
Park Heights, northwest of Druid Hill Park, has one avoid neighborhood, Langston Hughes (27.0), and several caution neighborhoods, including Central Park Heights (23.0), which recorded 100 violent crimes. Pimlico Race Course is in Park Heights.
Southwest Baltimore: Carrollton Ridge, Millhill and Franklin Square
Carrollton Ridge (48.7) has the highest rate in the Southwestern District, with 113 violent crimes and 3 homicides. Millhill (32.1), Shipley Hill (28.5) and Franklin Square (29.8) surround it along Frederick Avenue, Wilkens Avenue and the west end of Baltimore Street. Further south are Westport (30.3), on the Middle Branch, and Mount Winans (27.6) next to it. The Light Rail from BWI Airport stops in Westport and in Cherry Hill.
South Baltimore: Cherry Hill, Brooklyn and Curtis Bay
The Southern District recorded 24 homicides and 69 shooting victims, the most of the nine police districts, while its overall violent crime rate of 11.9 per 1,000 is below the city average. Brooklyn, Cherry Hill and Curtis Bay, south of the Middle Branch, account for 11 of those homicides and 27 of the shooting victims. Brooklyn recorded 7 homicides, the most of any neighborhood, and Cherry Hill 4 homicides and 10 shooting victims. Both rate average per resident because they are large: Brooklyn has 9,549 residents and Cherry Hill 7,647. Curtis Bay (14.1) recorded 7 shooting victims. Visitors have no reason to go to any of the three, and the Light Rail passes Cherry Hill on its way to BWI.
East Baltimore: Oldtown, Gay Street and McElderry Park
East Baltimore’s avoid neighborhoods run in a band from Oldtown and Gay Street, east of downtown, to Ellwood Park/Monument, about a mile and a half east along Monument Street and Orleans Street. Dunbar-Broadway has the highest rate in the city at 98.8 per 1,000, but it has only 749 residents and holds the Johns Hopkins Hospital campus: 27 of its 74 violent crimes were recorded at two addresses, the hospital on Orleans Street and one block of North Caroline Street. Gay Street (39.9) recorded 4 homicides, McElderry Park 101 violent crimes and Ellwood Park/Monument 116.
Broadway East (24.0) and Oliver (21.7), north of the hospital, rate caution. Patterson Park and the rowhouse neighborhoods around it, from Butchers Hill to Highlandtown, rate average or lower.
Charles North and Penn Station
Charles North (59.0) is the neighborhood around Penn Station and the Station North arts district. 28 of its 64 violent crimes were on North Avenue and the 2000 block of North Charles Street, north of the station, and the station’s own block recorded none. Old Goucher (26.8), a few blocks north, is on the list because of robberies at the stores on the 2400 block of North Charles Street. See the transit section below for arriving at Penn Station.
Areas to be careful in
Another 33 neighborhoods have between 18 and 26 violent crimes per 1,000 residents. Together with the avoid neighborhoods they hold 22% of Baltimore’s residents and 56% of its homicides.
| Neighborhood | District | Violent crimes per 1,000 | vs. city avg | Homicides | Shooting victims | Thefts + robberies |
|---|---|---|---|---|---|---|
| Harlem ParkWestern | Western | 25.9 | 2.0x | 0 | 4 | 91 |
| Reisterstown StationNorthwestern | Northwestern | 25.7 | 2.0x | 0 | 2 | 149 |
| JonestownCentral | Central | 25.3 | 2.0x | 0 | 2 | 63 |
| Pleasant View GardensCentral | Central | 25.3 | 2.0x | 0 | 1 | 18 |
| Penrose/Fayette Street OutreachSouthwestern | Southwestern | 24.3 | 1.9x | 1 | 4 | 99 |
| Baltimore HighlandsSoutheastern | Southeastern | 24.2 | 1.9x | 2 | 4 | 169 |
| Broadway EastEastern | Eastern | 24.0 | 1.9x | 1 | 5 | 129 |
| Madison ParkWestern | Western | 23.4 | 1.8x | 1 | 1 | 74 |
| Better WaverlyNorthern | Northern | 23.3 | 1.8x | 2 | 3 | 253 |
| Central Park HeightsNorthern | Northern | 23.0 | 1.8x | 2 | 8 | 161 |
| Federal HillSouthern | Southern | 23.0 | 1.8x | 3 | 7 | 146 |
| Druid HeightsWestern | Western | 22.9 | 1.8x | 2 | 4 | 40 |
| Heritage CrossingWestern | Western | 22.9 | 1.8x | 0 | 1 | 24 |
| Sandtown-WinchesterWestern | Western | 22.4 | 1.7x | 1 | 8 | 153 |
| Towanda-GrantleyNorthern | Northern | 22.3 | 1.7x | 1 | 4 | 48 |
| Mount ClareSouthwestern | Southwestern | 22.1 | 1.7x | 1 | 2 | 52 |
| OliverEastern | Eastern | 21.7 | 1.7x | 2 | 4 | 136 |
| Forest ParkNorthwestern | Northwestern | 21.5 | 1.7x | 1 | 1 | 21 |
| Garwyn OaksNorthwestern | Northwestern | 20.8 | 1.6x | 1 | 3 | 21 |
| Middle EastSoutheastern | Southeastern | 20.8 | 1.6x | 0 | 1 | 331 |
| Sharp-LeadenhallSouthern | Southern | 20.6 | 1.6x | 1 | 3 | 40 |
| Madison-EastendSoutheastern | Southeastern | 20.3 | 1.6x | 0 | 0 | 57 |
| Franklintown RoadWestern | Western | 20.2 | 1.6x | 1 | 3 | 51 |
| RosemontNorthwestern | Northwestern | 19.8 | 1.5x | 0 | 1 | 51 |
| Johnston SquareCentral | Central | 19.6 | 1.5x | 0 | 5 | 68 |
| O'Donnell HeightsSoutheastern | Southeastern | 19.5 | 1.5x | 1 | 1 | 15 |
| Boyd-BoothSouthwestern | Southwestern | 19.4 | 1.5x | 0 | 0 | 12 |
| Saint JosephsSouthwestern | Southwestern | 19.4 | 1.5x | 1 | 3 | 30 |
| Evergreen LawnWestern | Western | 19.2 | 1.5x | 0 | 0 | 25 |
| DolfieldNorthwestern | Northwestern | 18.9 | 1.5x | 1 | 1 | 43 |
| Harbor EastCentral | Central | 18.3 | 1.4x | 1 | 0 | 218 |
| Morrell ParkSouthern | Southern | 18.1 | 1.4x | 2 | 3 | 147 |
| ArlingtonNorthwestern | Northwestern | 18.0 | 1.4x | 2 | 2 | 52 |
- Federal Hill (23.0). The bar district south of the Inner Harbor. See the Federal Hill section below.
- Harbor East (18.3). Hotels and restaurants between the Inner Harbor and Fells Point, with 1,037 residents. Its 218 thefts and robberies were mostly shoplifting.
- Sandtown-Winchester (22.4) and Harlem Park (25.9). West Baltimore rowhouse neighborhoods between the avoid clusters.
- Jonestown (25.3). The historic blocks east of the Jones Falls Expressway with the Star-Spangled Banner Flag House and the Jewish Museum of Maryland. Visit during the day.
- Middle East (20.8). The blocks north of Johns Hopkins Hospital, with 331 thefts and robberies.
Is the Inner Harbor safe?
The Inner Harbor is safe for visitors during the day and in the evening. Harborplace, the National Aquarium and the promenade along Pratt Street and Light Street are in a waterfront area with 394 residents, which is why it is grey on the map. It recorded 52 violent crimes in 12 months, most of them on Pratt Street, and 237 thefts and robberies, most of them shoplifting.
The ten neighborhoods visitors use around the harbor (the Inner Harbor, Downtown, Downtown West, Harbor East, Little Italy, Fells Point, Federal Hill, Otterbein, the stadium area and Mount Vernon) recorded 727 violent crimes and 2,113 thefts and robberies, about three thefts for every violent crime. 26% of the violent crimes happened between midnight and 4 a.m. 37% of the thefts and robberies happened between noon and 6 p.m.
The risk rises a few blocks north and west of the water. The Downtown neighborhood (55.4) recorded 397 violent crimes, more than any other neighborhood, and 810 thefts and robberies. The Block, the strip of adult clubs on the 400 block of East Baltimore Street, recorded 22 of them, the most of any downtown block. Lexington Market and the Howard Street Light Rail stops are in the same neighborhood.
- Stay on Pratt Street, Light Street and the waterfront promenade at night. After dark, avoid the blocks around Lexington Market and Howard Street, west of Charles Street.
- Visit Lexington Market for lunch, not in the evening.
- Keep your phone in your pocket at bus stops and outdoor tables on Pratt Street and Light Street.
- The Water Taxi links the Inner Harbor with Fells Point, Canton and Fort McHenry.
Is Fells Point safe?
Fells Point is safe to visit, including at night on its main streets. It rates average at 17.0 per 1,000 and recorded 80 violent crimes, 27 of them on Thames Street and the square at the foot of Broadway, where the bars are. Thefts from cars and shoplifting make up about half of its 241 thefts and robberies. Little Italy (14.8) and Harbor East (18.3) are between Fells Point and the Inner Harbor.
Canton, east of Fells Point, is one of the lowest-rate neighborhoods near the water at 3.8 per 1,000. It recorded 505 thefts and robberies, the second-most of any neighborhood after Downtown, about half of them thefts from cars and shoplifting.
- Bars close at 2 a.m. Leave by rideshare or taxi from Thames Street or Broadway, not on foot north of Fleet Street.
- Park in a garage or on a lit street, and leave nothing visible in the car.
Is Federal Hill safe?
Federal Hill is safe during the day and in the evening. Late at night, the bar blocks call for caution. It rates caution at 23.0 per 1,000 and recorded 62 violent crimes, including 3 homicides, among only 2,695 residents. 34 of those violent crimes were on the bar blocks of Cross Street and South Charles Street around Cross Street Market. Federal Hill Park, at the top of the hill, overlooks the Inner Harbor.
Oriole Park at Camden Yards and M&T Bank Stadium share the stadium area west of Federal Hill. It recorded 6 violent crimes and 49 thefts and robberies in 12 months. Otterbein (2.6), Riverside (2.3), South Baltimore (1.8) and Locust Point (0.3) are among the lowest-rate neighborhoods in the city. Fort McHenry is at the tip of the Locust Point peninsula.
- After an Orioles or Ravens game, walk back to the Inner Harbor with the crowd on Conway Street or Light Street.
- At closing time on Cross Street, take a rideshare instead of walking west of Hanover Street.
Penn Station, the Light Rail and the Metro
Penn Station, where Amtrak and the MARC Penn Line stop, is in Charles North, an avoid neighborhood at 59.0 per 1,000. The station’s own block recorded no violent crime in 12 months. The violence is a few blocks north, on North Avenue. Take a taxi or rideshare from the station to the Inner Harbor, about a mile and a half south, or the Light Rail spur from the station to the main line. On foot during the day, walk south on Charles Street through Mount Vernon.
The Light Rail runs from BWI Airport through Cherry Hill and Westport to Camden Yards, then north on Howard Street past the Convention Center and Lexington Market. The Metro SubwayLink runs from Owings Mills through Mondawmin, Penn-North and Upton to Lexington Market, Charles Center and Johns Hopkins Hospital. Baltimore Police recorded 18 violent crimes at bus and rail stations in 12 months.
- Ride the Light Rail between BWI and Camden Yards during the day, and stay on the train through Cherry Hill and Westport.
- Use the Metro for downtown stops. Don’t get off at Penn-North, Mondawmin or Upton.
- MARC trains from Washington stop at Penn Station on the Penn Line and at Camden Station, next to Oriole Park, on the Camden Line.
Safest neighborhoods to stay in Baltimore
These are the neighborhoods visitors stay in, with the same 12-month figures.
| Neighborhood | District | Violent crimes per 1,000 | vs. city avg | Homicides | Shooting victims | Thefts + robberies |
|---|---|---|---|---|---|---|
| Locust PointSouthern | Southern | 0.3 | 0.0x | 0 | 0 | 79 |
| CantonSoutheastern | Southeastern | 3.8 | 0.3x | 0 | 0 | 505 |
| Mount WashingtonNorthwestern | Northwestern | 0.7 | 0.1x | 0 | 0 | 34 |
| Roland ParkNorthern | Northern | 2.1 | 0.2x | 0 | 0 | 50 |
| OtterbeinSouthern | Southern | 2.6 | 0.2x | 0 | 0 | 48 |
| HampdenNorthern | Northern | 7.9 | 0.6x | 0 | 0 | 244 |
| Mount VernonCentral | Central | 12.6 | 1.0x | 1 | 0 | 264 |
| Fells PointCentral | Central | 17.0 | 1.3x | 1 | 6 | 241 |
| Inner HarborCentral | Central | n/a | n/a | 0 | 0 | 237 |
| Harbor EastCentral | Central | 18.3 | 1.4x | 1 | 0 | 218 |
| Federal HillSouthern | Southern | 23.0 | 1.8x | 3 | 7 | 146 |
- Locust Point (0.3 per 1,000) and Canton (3.8) are waterfront rowhouse neighborhoods a short Water Taxi ride from the Inner Harbor. Canton has more car break-ins than violent crime.
- Mount Washington (0.7) and Roland Park (2.1) are residential neighborhoods in North Baltimore, 15 minutes by car from downtown. Mount Washington has a Light Rail stop.
- Hampden (7.9) has its shops and restaurants on 36th Street, known locally as The Avenue, near the Johns Hopkins Homewood campus.
- Otterbein (2.6) is a small historic district between the Inner Harbor and Federal Hill, within walking distance of Camden Yards.
- Mount Vernon (12.6) has the Washington Monument, the Walters Art Museum and the Peabody Institute, with hotels on Charles Street. It rates average.
- The Inner Harbor and Harbor East have most of the city’s large hotels. The Inner Harbor has no rate because few people live there. Harbor East rates caution at 18.3, and most of what is reported there is shoplifting.
Is Baltimore getting safer?
Yes. Baltimore Police recorded 323 homicide victims in 2022, 247 in 2023, 196 in 2024 and 136 in 2025, a 58% drop in three years. Shooting victims fell by 55% over the same years, from 937 to 425. The decline continued: 121 homicides in the 12 months to September 2026, against 149 a year earlier, and 84 from January to September 2026, against 99 in the same months of 2025.
Violent crime as a whole fell less. The 7,821 violent crimes of the last 12 months are 3% below the 12 months before, and the 2025 total was 23% below 2022’s. Robberies fell 14% year over year, while aggravated assaults rose 4% and thefts rose 8%.
Baltimore County and the rest of the region
Baltimore City is a separate jurisdiction from Baltimore County, which surrounds it on three sides and includes Towson, Catonsville and Dundalk. The city’s 13.51 violent crimes per 1,000 residents in 2025 was 4.6 times the rate of the rest of the region in this table, 2.94. The city has 21% of the region’s residents in this table and 55% of its violent crime. This table compares whole jurisdictions using the figures each agency reports to the FBI.
| City / county | Population | Violent crimes | Per 1,000 | Year |
|---|---|---|---|---|
| Baltimore City | 562,811 | 7,601 | 13.5 | 2025 |
| Annapolis | 40,647 | 289 | 7.1 | 2025 |
| Aberdeen | 19,047 | 77 | 4.0 | 2025 |
| Baltimore County | 849,486 | 3,406 | 4.0 | 2025 |
| Anne Arundel County (outside Annapolis) | 562,033 | 1,538 | 2.7 | 2025 |
| Westminster | 20,797 | 44 | 2.1 | 2025 |
| Harford County (Sheriff's Office) | 221,056 | 339 | 1.5 | 2025 |
| Bel Air | 10,321 | 15 | 1.5 | 2025 |
| Howard County | 340,315 | 396 | 1.2 | 2025 |
| Havre de Grace | 15,320 | 12 | 0.8 | 2025 |
Murder, rape, robbery and aggravated assault reported to the FBI by each agency, per 1,000 residents of the population the agency reports. Source: FBI Crime Data Explorer. Agencies that report no complete year are left out.
- Annapolis, the state capital and home of the Naval Academy, has the second-highest rate in the table after Baltimore City. Its historic district and City Dock draw visitors, which raises the per-resident rate the same way crowds raise downtown Baltimore’s.
- Baltimore County has about four violent crimes per 1,000 residents, under a third of the city’s rate. The region as a whole, city included, had 5.19.
- Howard County, with Columbia and Ellicott City, has the lowest rate of the county police departments.
- Carroll County is left out. Its Sheriff’s Office reports a population of 2,793 to the FBI, a small part of the county, so its rate is not comparable.
Baltimore safety tips for visitors
- Check a rental’s exact address on the map before you book. A listing described as near Penn Station, Johns Hopkins Hospital or the University of Maryland can be in an avoid neighborhood.
- Leave nothing visible in a parked car. Thefts from cars made up 28% of all thefts in the city, 4,576 in 12 months, and Baltimore Police recorded 4,685 vehicle thefts.
- Use the Water Taxi or a rideshare between the Inner Harbor, Fells Point, Canton and Fort McHenry after dark.
- Stay on the busy streets. In Baltimore, a lively block and a dangerous one can be two streets apart.
- Call 911 for emergencies and 311 for non-emergency city services.
How this map was made
Crime counts come from the Baltimore Police Department’s NIBRS crime records on Open Baltimore, which list every offense reported to the department, for October 2025 through September 2026. Violent crime means homicide, rape, robbery and aggravated assault. Homicides, rapes and assaults count once per victim and robberies once per incident, as the FBI counts them. Shooting victims are the victims the department flags as shot, plus homicide victims killed with a firearm. Population is the 2020 Census count by census block, the most recent full count. The year-over-year figures come from the same records. The regional table uses each agency’s reports to the FBI’s Crime Data Explorer.
The neighborhoods are Baltimore’s 279 official Neighborhood Statistical Areas. The tiers are Avoid (26 or more violent crimes per 1,000 residents), Use caution (18 to 26), Average (8 to 18) and Lower risk (under 8). Neighborhoods with fewer than 500 residents are grey and not ranked. The theft layer counts thefts and robberies, not rates, because a per-resident rate means little where most of the people present live elsewhere.
Conditions change from block to block. Per-resident rates overstate risk where few people live and many visit, which applies to Downtown, the Inner Harbor and the hospital campuses. We built the same map for the areas to avoid in Chicago, the areas to avoid in New York City, the areas to avoid in San Francisco, the areas to avoid in Los Angeles, the areas to avoid in Miami, the areas to avoid in Atlanta and the areas to avoid in Detroit.
FAQ
Is Baltimore safe to visit?
Yes, in the places most visitors go. The Inner Harbor, Fells Point, Canton, Federal Hill, Mount Vernon and Locust Point are not among the areas to avoid. Baltimore's violent crime rate was 12.9 per 1,000 residents between October 2025 and September 2026, and homicides fell from 323 in 2022 to 136 in 2025. The neighborhoods with the most violence are in West Baltimore, East Baltimore and Southwest Baltimore, away from the harbor.
What areas of Baltimore should you avoid?
The 34 neighborhoods with at least double the city's violent crime rate are Penn North, Upton, Mondawmin, Liberty Square, Mosher, Winchester, Easterwood, Midtown-Edmondson, Auchentoroly-Parkwood, Coppin Heights/Ash-Co-East, Rosemont Homeowners/Tenants, Northwest Community Action and Langston Hughes in West and Northwest Baltimore; Carrollton Ridge, Millhill, Shipley Hill, Franklin Square, Westport and Mount Winans in Southwest and South Baltimore; Oldtown, Gay Street, Dunbar-Broadway, CARE, McElderry Park, Ellwood Park/Monument, Milton-Montford, East Baltimore Midway and South Clifton Park in East Baltimore; Charles North, Old Goucher and Woodbourne-McCabe north of downtown; and Downtown, Seton Hill and University of Maryland in the city center.
Is the Inner Harbor safe?
Yes. The Inner Harbor recorded 52 violent crimes in 12 months, most of them on Pratt Street, and 237 thefts and robberies, most of them shoplifting. Stay on Pratt Street, Light Street and the waterfront promenade at night. The Downtown neighborhood a few blocks north, around Lexington Market and Howard Street, is on the avoid list at 55.4 violent crimes per 1,000 residents.
Is Fells Point safe at night?
Fells Point's main streets are busy until the bars close at 2 a.m. and are safe in the evening. The neighborhood rates average at 17.0 violent crimes per 1,000 residents, and most of its violent crime is on Thames Street and the square at the foot of Broadway. Leave by rideshare or taxi late at night.
Is it safe to walk from Penn Station?
During the day, yes: walk south on Charles Street through Mount Vernon to the Inner Harbor, about a mile and a half. Penn Station is in Charles North, an avoid neighborhood at 59.0 violent crimes per 1,000 residents, but the station's own block recorded no violent crime in 12 months. The violence is a few blocks north, on North Avenue. At night, take a taxi or rideshare from the station.
Is Federal Hill safe?
Federal Hill is safe during the day and in the evening. It rates caution at 23.0 violent crimes per 1,000 residents because of the bar blocks on Cross Street and South Charles Street late at night. Take a rideshare at closing time. Otterbein, Riverside and Locust Point next to it are among the lowest-rate neighborhoods in the city.
Is West Baltimore dangerous?
Parts of it are. The Western District has a violent crime rate of 24.5 per 1,000 residents, almost twice the city average, and holds 10 of the 34 areas to avoid, including Penn North (62.0), Upton and Mondawmin. Bolton Hill, on the east side of the district, has less than half the city rate at 6.0.
What is the safest area to stay in Baltimore?
Locust Point (0.3 violent crimes per 1,000 residents), Canton (3.8), Mount Washington (0.7) and Roland Park (2.1) have the lowest rates of the neighborhoods visitors stay in. Most hotels are at the Inner Harbor and in Harbor East, where the main risk is theft.
Is crime in Baltimore going down?
Yes. Baltimore Police recorded 121 homicides in the 12 months to September 2026, against 149 a year earlier and 323 in 2022. Shooting victims fell 14% in the last year. Violent crime as a whole fell 3%, because aggravated assaults rose while robberies fell.