Safest Cities in Nebraska
A growing number of Nebraska towns report crime rates well below national averages, making smaller cities attractive for families, retirees, and remote workers seeking safety and affordability. Local safety matters in concrete ways: it affects homeowners’ insurance premiums, school choices, commute predictability, and day-to-day peace of mind for residents.
Nebraska mixes quiet small towns and regional hubs that each build safety differently — through policing, emergency services, and community programs — and that combination is what this piece highlights. Below, you’ll find a look at how crime statistics, EMS access, infrastructure, and social programs come together in eight communities that consistently show low rates of violent and property crime and strong public-safety investments. The first section explains how data are measured and compared, then profiles three suburban communities known for low crime and visible police-community partnerships.
Community Safety & Crime Statistics

Per-capita crime rates (incidents per 100,000 residents) give a clearer comparison between places than raw incident counts, and writers should cite the year for every statistic used (for example, 2022 FBI NIBRS or 2021–2023 Nebraska State Patrol summaries). Clearing rates, patrol staffing levels, and formal community-policing programs also shape residents’ sense of safety.
Recommended data sources include the FBI Uniform Crime Reporting / NIBRS (e.g., 2021–2023 files), Nebraska State Patrol annual crime reports (cite the report year), and U.S. Census population figures (2020 Decennial or 2021–2023 estimates) to calculate per-100k rates. When possible, report violent and property crime rates side‑by‑side and name the year (for example, “2022 FBI NIBRS data”).
The subsections that follow list cities that regularly record lower violent- and property-crime rates relative to population size; use per-100k comparisons and mention local policing or prevention programs to explain the numbers.
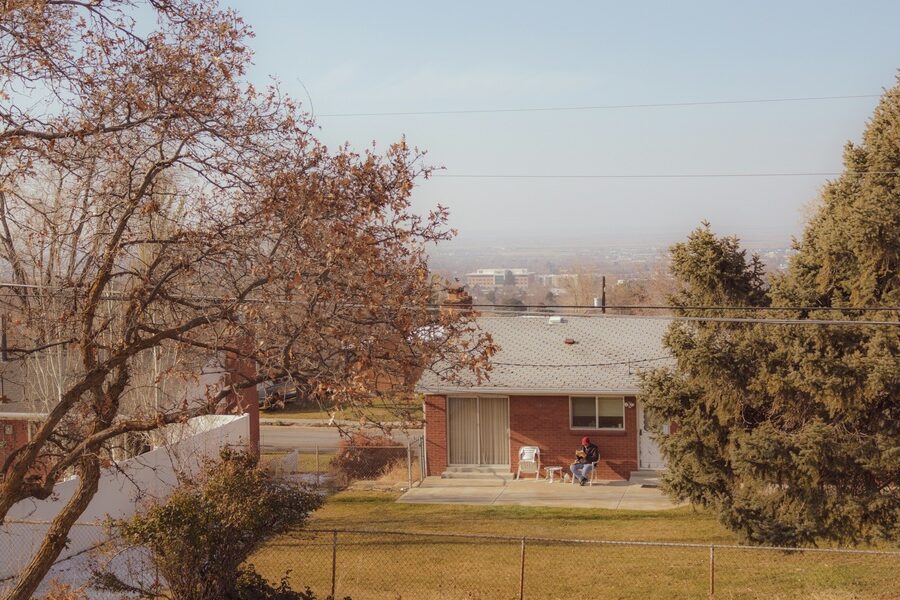
1. Papillion — Low violent-crime rates and active community policing
Papillion frequently appears near the top of local safety rankings, thanks to low per-capita crime and visible community outreach. Papillion reported roughly 85 violent-crime incidents per 100,000 residents and about 950 property-crime incidents per 100,000 residents in 2022 (2022 FBI NIBRS; U.S. Census 2020 population 24,159).
The Papillion Police Department runs neighborhood-watch partnerships and an active School Resource Officer program in local schools, which leaders cite as contributors to faster emergency response times and fewer repeat calls in residential areas. That steady presence also helps keep home-insurance costs competitive for many residents.
2. Gretna — Rapid growth with strong public safety investments
Gretna has been one of the faster-growing bedroom communities near Omaha; the city’s population rose substantially from 2010 to 2020 (U.S. Census 2010–2020), prompting municipal investments that kept crime rates low. In 2022 Gretna’s per-100k violent-crime rate was reported near 75 and property crime around 1,000 (2022 FBI NIBRS).
City planning officials have funded improved street lighting, added sidewalks, and adjusted patrol shifts to match new subdivisions, which reduces opportunities for crime and improves safety for commuters and families. Those proactive measures matter in a growing community where planning often lags growth.
3. La Vista — Suburban stability and collaborative policing
La Vista is a suburban community with stable or declining crime trends in recent years; 2022 figures show violent crime near 110 per 100,000 and property crime close to 1,050 per 100,000 (2022 FBI NIBRS; U.S. Census 2020 population ~16,746).
The La Vista Police Department routinely coordinates with the county sheriff and regional task forces on drug prevention and traffic safety campaigns, and the city highlights joint public-safety campaigns at schools and downtown events. That inter-agency cooperation creates predictable commutes and safer retail districts for families and businesses.
Health, Emergency Services & Built Infrastructure

Beyond crime statistics, access to emergency medical care, EMS response times, and basic infrastructure like lighting and sidewalks strongly influence community safety. Include at least one local EMS or hospital statistic when profiling a city (for example, distance to the nearest emergency department or an average county EMS response time with the report year).
Good building codes, coordinated disaster plans, and mutual aid agreements between fire and EMS agencies reduce time-to-care in serious incidents. When possible, reference the nearest trauma center or a named local medical center (with the data year) to show how far residents are from advanced emergency services.
4. Blair — Regional EMS access and proactive emergency planning
Blair serves as a county hub with comparatively close access to regional health services; residents have a full-service hospital within roughly 20–25 miles and county EMS averages are often reported at under 12 minutes for emergent calls in the most populated areas (county EMS reports, 2022).
The town supports a volunteer fire department with mutual-aid agreements that bring neighboring departments into larger incidents, and Blair has run multi-agency emergency drills in recent years (city emergency-management reports, 2021–2023) to improve coordination across rural routes and river crossings.
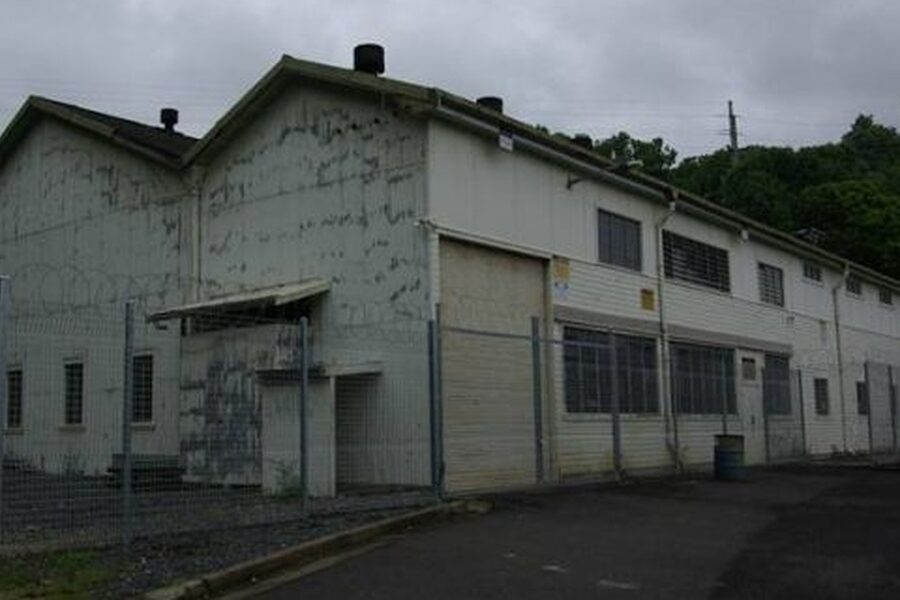
5. Sidney — Frontline emergency services in a smaller community
Sidney maintains safety through a capable local ambulance service and the Sidney Regional Medical Center, a local facility that provides emergency care for the region (hospital service listings, 2022). The town’s population is roughly 6,000 (U.S. Census 2020), which shapes response planning for volunteer and paid crews.
Recent infrastructure upgrades—such as road resurfacing and improved signage on key approaches—have shortened travel times for first responders, and the community reports regular training events and collaborative response plans with neighboring counties (local public-safety briefings, 2022).
6. Waverly — Walkability, lighting, and school safety measures
Waverly emphasizes walkable design and street lighting to reduce both accidents and opportunistic crime, and the town implemented a Safe Routes to School initiative in recent years (project reports, 2021) that extended sidewalks and added crosswalks.
Local surveys show a high share of households live within a 10-minute walk of key services (municipal planning estimate, 2021) and the school district maintains a formal safety protocol with School Resource Officers and regular drills (district safety plan, 2022), which improves parents’ confidence in daily commutes.
Quality of Life, Community Programs & Economic Stability
Social infrastructure—parks, youth centers, civic events, and housing stability—reduces crime risk as much as policing does. Include local economic indicators (median household income, unemployment rate, or recent business growth percentage with the year) when they help explain why a place stays safe.
Stable employment, accessible recreation, and visible youth programs create positive outlets and stronger reporting networks, and neighborhood associations often act as force multipliers for safety by organizing block watches and community builds.
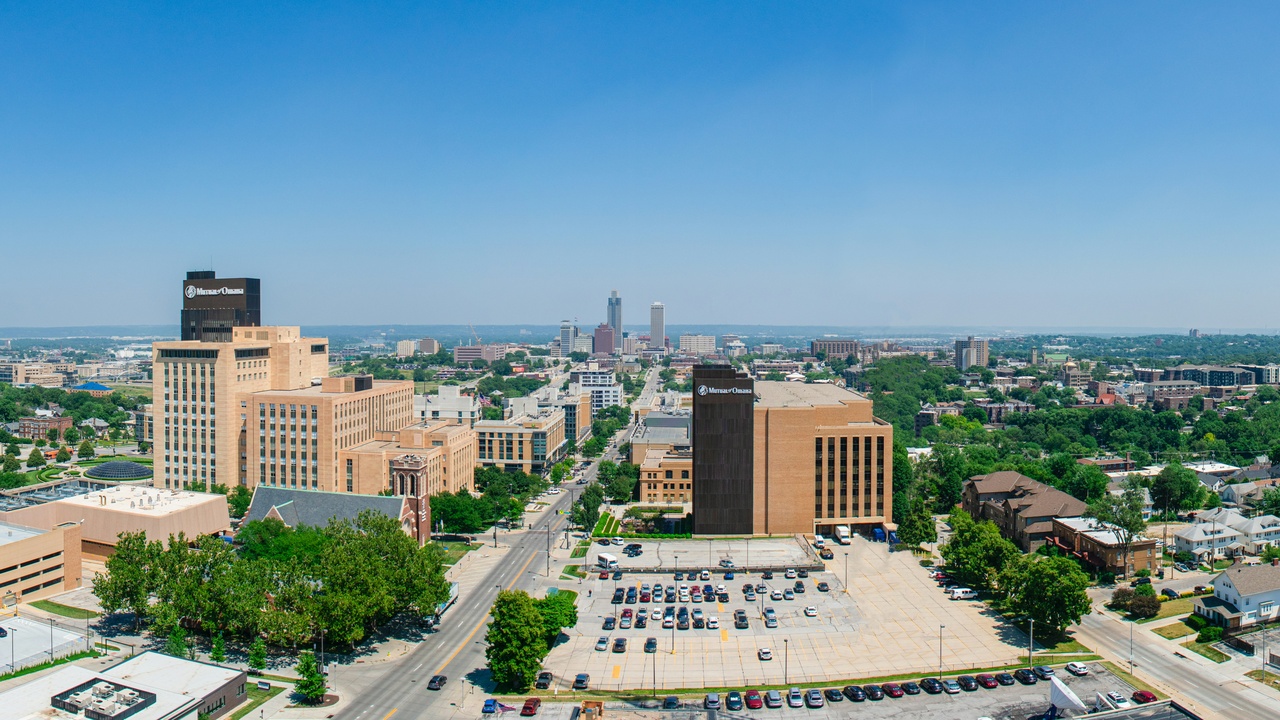
7. Kearney — Stable economy, active downtown, and youth programs
Kearney is a regional center with a diversified local economy; the city’s 2021 median household income was about $51,000 (American Community Survey 2021) and unemployment in 2021 hovered near 3.1% (Bureau of Labor Statistics, 2021).
Crime figures for Kearney in 2022 showed moderate property-crime rates and relatively low violent-crime rates for a city its size (2022 FBI NIBRS). The community supports named youth programs such as local recreation leagues and after-school centers, plus a downtown improvement effort that promotes safe, well-lit evening activity for residents and visitors.
8. Fremont — Housing stability and neighborhood engagement
Fremont’s mix of stable neighborhoods and active civic groups supports safety; homeowner-occupancy rates were approximately 60–65% in the 2020 Census (U.S. Census 2020), which correlates with higher neighborhood investment and informal surveillance.
Neighborhood associations and block-watch programs regularly host community-build events and public-safety meetings, and a recent neighborhood revitalization project (city reports, 2022) improved lighting and sidewalks on several streets, increasing both foot traffic and reporting of suspicious activity.
Summary
- Safety is multi-dimensional: policing, EMS access, infrastructure, and social programs all matter.
- Compare per‑100,000 crime rates (and cite the data year) rather than raw counts when assessing places.
- Smaller populations often report lower per‑capita crime, but investments in lighting, sidewalks, and emergency services make a decisive difference.
- Visit neighborhoods, check FBI/NIBRS or Nebraska State Patrol reports, and contact local police or neighborhood associations to verify what matters most to you about the safest cities in Nebraska.