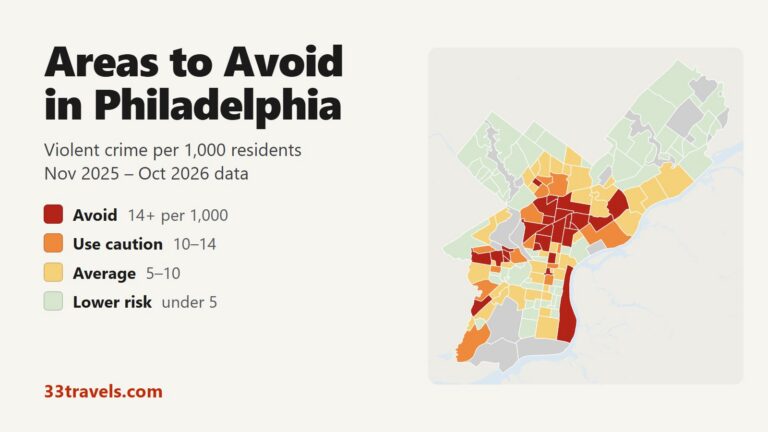
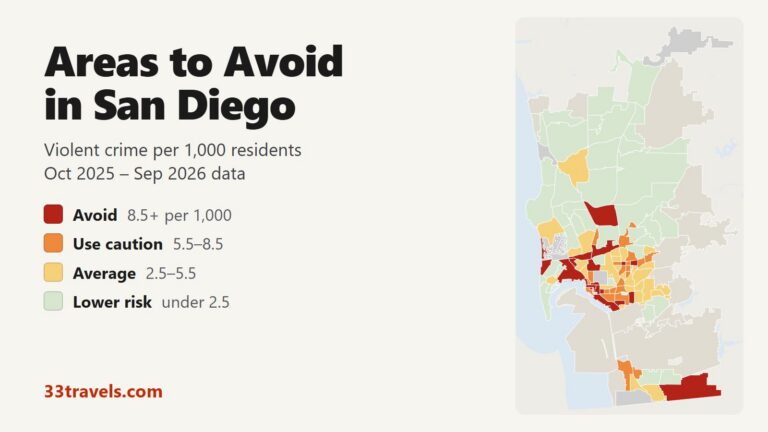
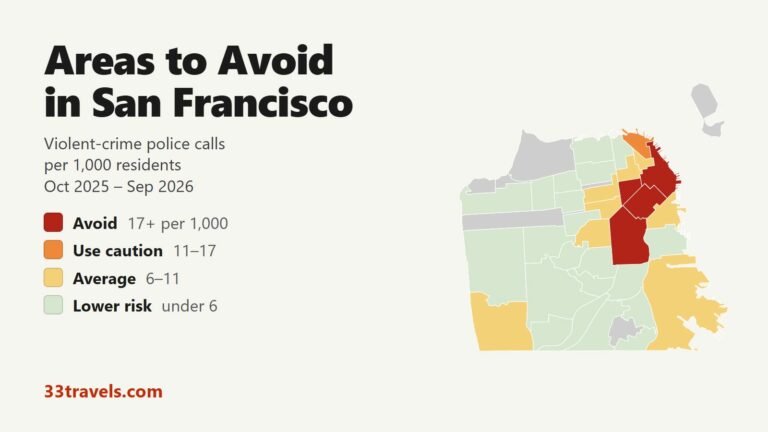
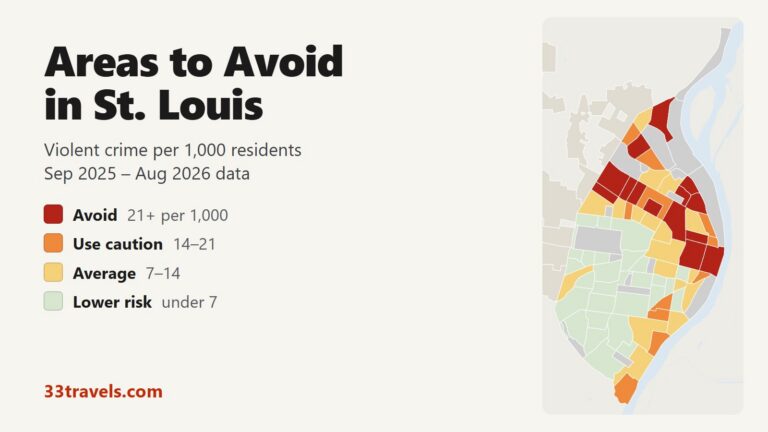
How crime is concentrated
Criminologists call this the law of crime concentration. Across cities in the US, Israel and elsewhere, about half of all recorded crime happens on 2% to 6% of street segments, and a quarter on roughly 1%. The pattern holds year after year, even as total crime rises or falls.
Violent and property crime
The FBI counts four offenses as violent crime: murder and nonnegligent manslaughter, rape, robbery and aggravated assault. Property crime covers burglary, larceny-theft, motor vehicle theft and arson. Property crime is far more common, outnumbering violent crime by about five to one nationally. For visitors, the usual risks are car break-ins and phone or bag theft, which cluster in busy downtown and nightlife districts.
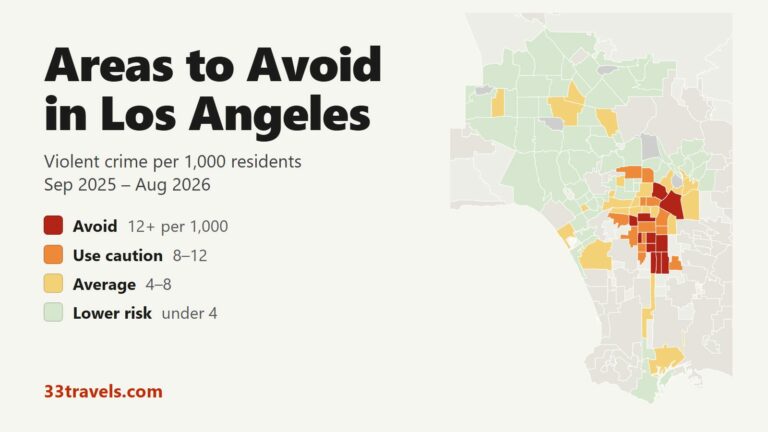
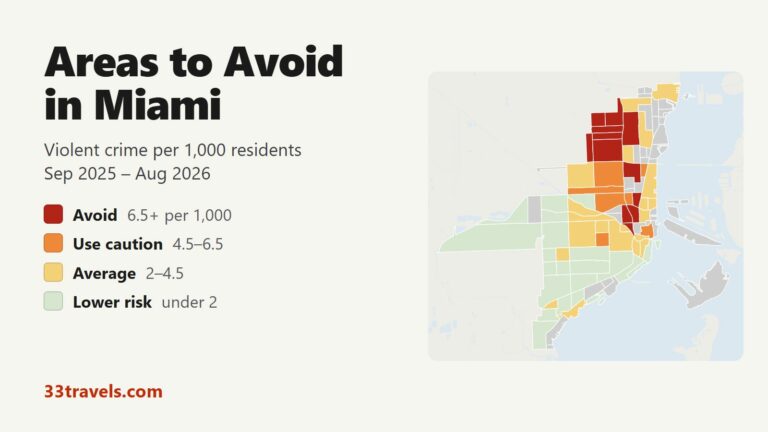
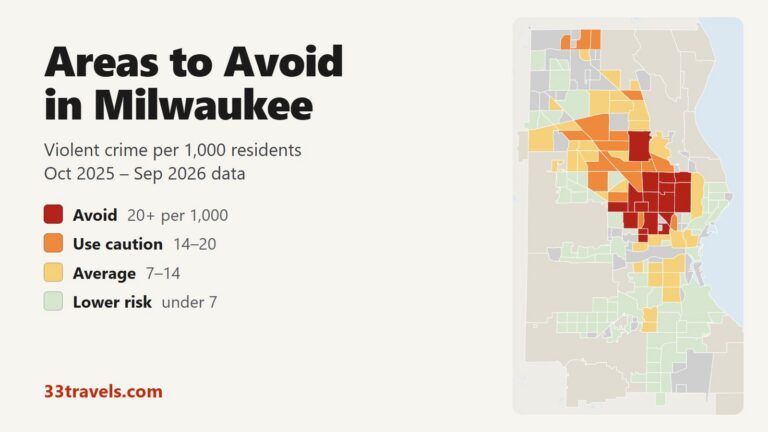
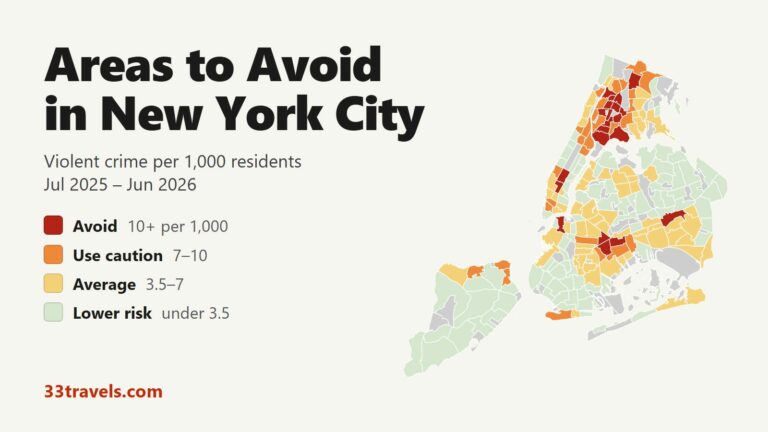
Crime rates per 1,000 residents
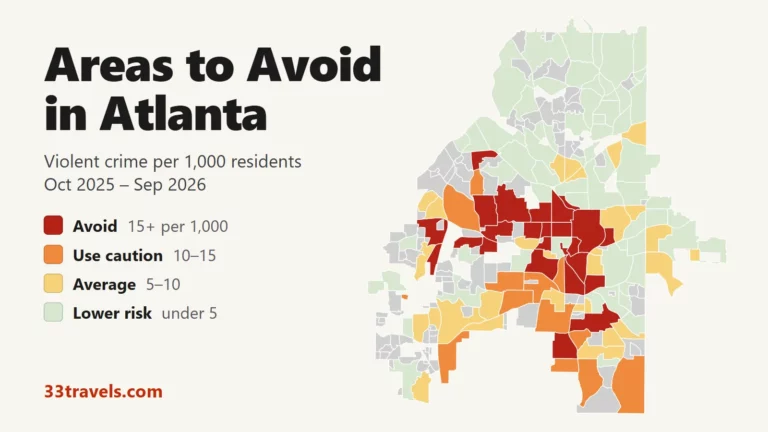
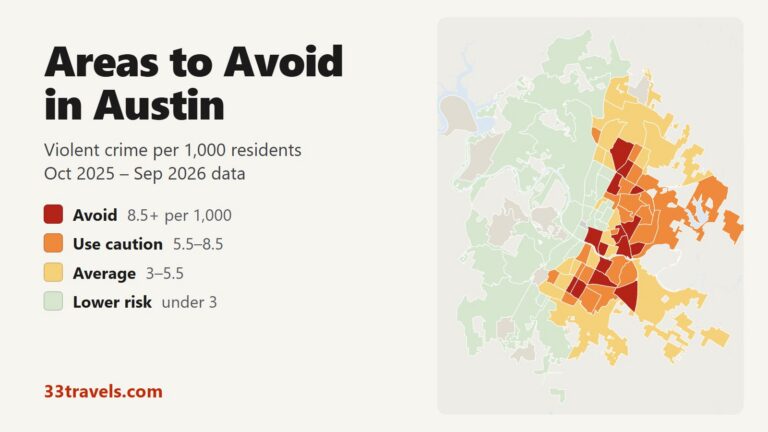
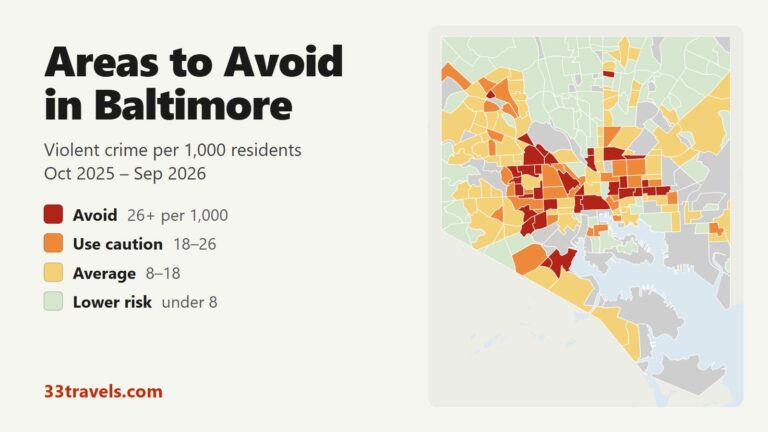
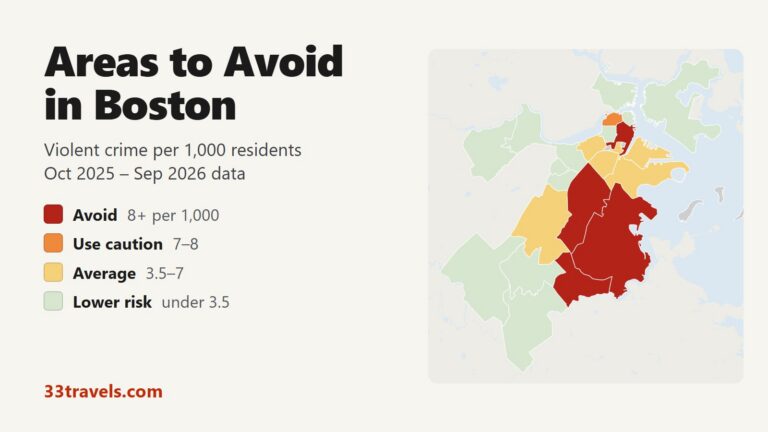
A crime rate divides the number of offenses by the number of residents and multiplies by 1,000, so a small neighborhood and a large one can be compared directly. The rate has one weak spot: places with few residents and many visitors. Downtowns, stadium districts and airports draw tens of thousands of people a day but have few homes, so their per-resident rates look higher than the risk to any one person.
Comparing one city with another
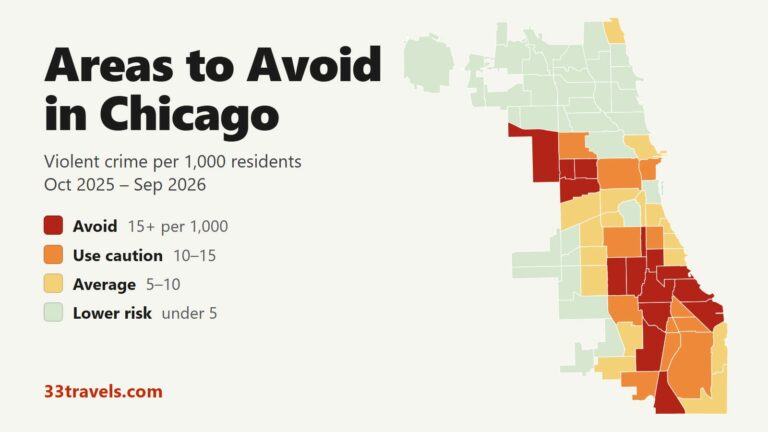
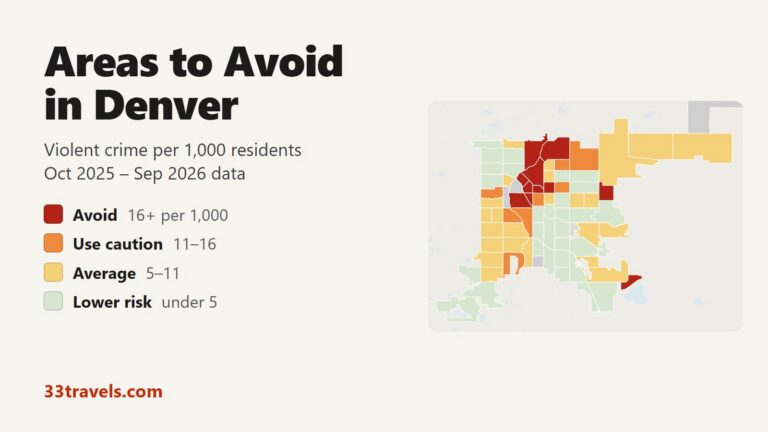
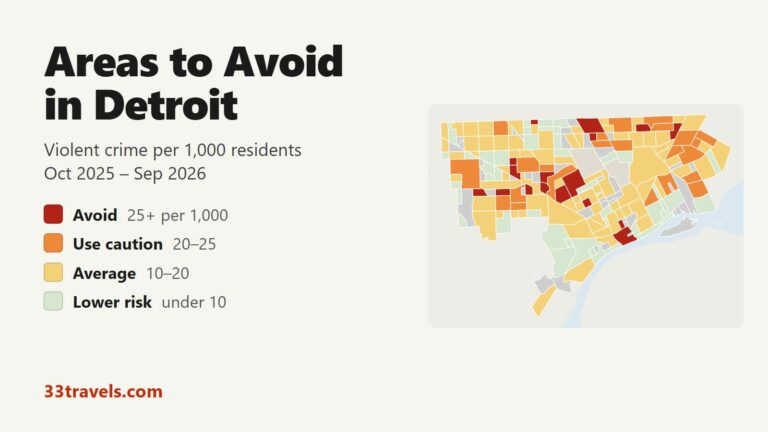
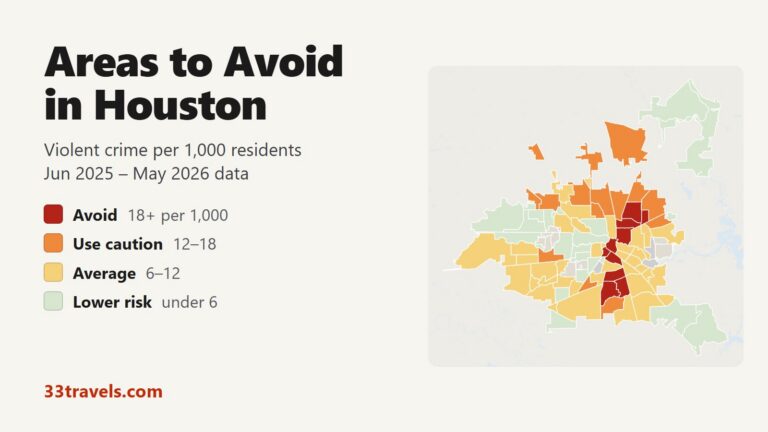
Each map sets its ratings against its own city’s average. An area marked “avoid” in Boston is not as dangerous as one marked “avoid” in Detroit. Police departments also count differently: some record each victim, others each incident. Since 2021 the FBI has collected data through NIBRS, which logs every offense in an incident. The older system logged only the most serious one.
What police data misses
Police records only include crimes that reach the police. The National Crime Victimization Survey finds that fewer than half of violent crimes and about a third of property crimes are reported. Many departments also withhold the location of sexual offenses to protect victims, so those crimes appear in city totals but not on maps.
Sources