
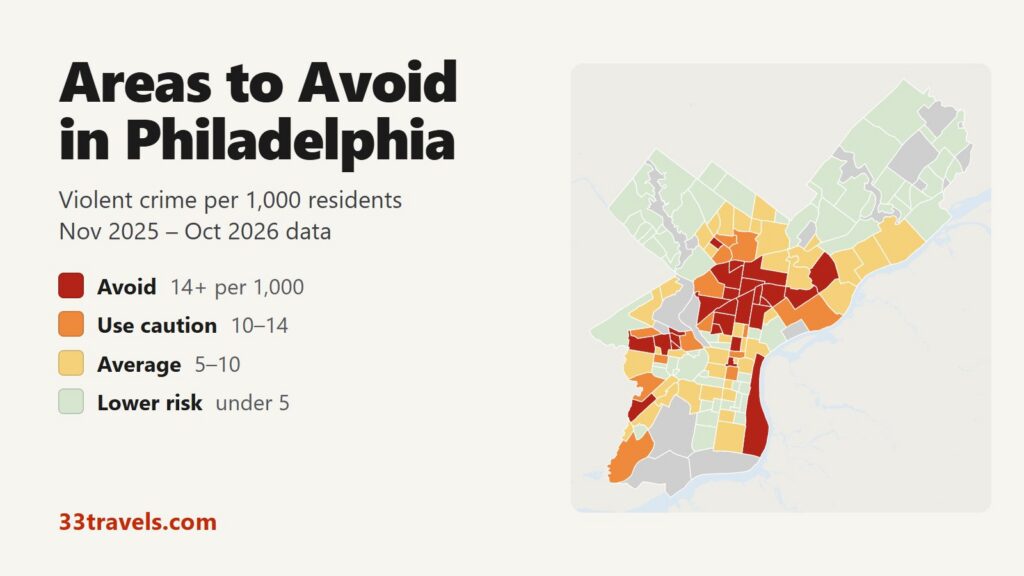
Most of the areas to avoid in Philadelphia are in North Philadelphia, in the neighborhoods on both sides of North Broad Street from Strawberry Mansion east to Kensington Avenue and north to Hunting Park. Smaller clusters sit in West Philadelphia around Haddington and Mill Creek, in Paschall in the southwest and in Frankford in the lower Northeast. From November 2025 to October 2026, 26 neighborhoods had 14 or more violent crimes per 1,000 residents, close to twice the city rate of 7.3. They house 15% of Philadelphians but recorded 36% of the city’s violent crime, 46% of its shooting victims and 67 of its 179 homicides.
Neighborhoods to avoid in Philadelphia: Stanton, Strawberry Mansion, Sharswood, North Central, Glenwood, Hartranft, Franklinville, Tioga, Nicetown and Hunting Park in North Philadelphia. Upper Kensington, West Kensington, Fairhill, McGuire and Harrowgate in Kensington. Haddington, Mill Creek, Belmont, East Parkside, Haverford North and Paschall in West and Southwest Philadelphia. Frankford in the Northeast. Germantown – Penn Knox in Germantown. Center City East, West Poplar and the Riverfront strip near the center.
Philadelphia’s violent crime rate is about half of Detroit’s and well above Austin’s. Center City East and the Riverfront have the two highest rates on the map, but few people live in them: they hold City Hall, the Market Street shopping blocks and the big-box stores on Columbus Boulevard, and the rate divides crimes against visitors by a tiny resident count. Shooting victims fell 28% and homicides 27% compared with the previous 12 months, while overall violent crime fell 2%.
Philadelphia safety map
Each neighborhood is shaded by its violent crime rate: red for avoid, orange for use caution, yellow for average and green for lower risk. Grey marks parks, the airport, industrial land and neighborhoods with too few residents for a rate. The view buttons zoom to North, Northeast, West & Southwest, Northwest or Center City & South. The Theft & robbery layer switches the shading to thefts and robberies, which is the map to check for pickpocketing and car break-ins. Select any neighborhood to see its counts.
Violent crimes per 1,000 residents
Thefts & robberies per area
Tap or hover a neighborhood to see its numbers.
Table of Contents
- Areas to avoid in Philadelphia
- Areas to be careful in
- Is Center City Philadelphia safe?
- Is Kensington safe?
- Is South Street safe?
- Is SEPTA safe?
- Philadelphia crime rate
- Car break-ins and car theft in Philadelphia
- Safest neighborhoods to stay in Philadelphia
- Upper Darby, Cherry Hill and the suburbs
- Philadelphia safety tips for visitors
- How this map was made
- FAQ
Areas to avoid in Philadelphia
The table lists the 26 neighborhoods at or above 14 violent crimes per 1,000 residents. The fifth column counts people shot, fatally or not, from the police shootings dataset.
| Neighborhood | Council district | Violent crimes per 1,000 | vs. city avg | Homicides | Shooting victims | Thefts + robberies |
|---|---|---|---|---|---|---|
| Center City EastDistrict 1 | District 1 | 48.8 | 6.7x | 0 | 1 | 514 |
| RiverfrontDistrict 1 | District 1 | 32.2 | 4.4x | 0 | 1 | 886 |
| Haverford NorthDistrict 3 | District 3 | 29.1 | 4.0x | 0 | 3 | 63 |
| StantonDistrict 5 | District 5 | 26.4 | 3.6x | 8 | 33 | 351 |
| GlenwoodDistrict 8 | District 8 | 22.3 | 3.1x | 0 | 12 | 161 |
| FranklinvilleDistrict 5 | District 5 | 21.8 | 3.0x | 4 | 22 | 216 |
| TiogaDistrict 8 | District 8 | 20.1 | 2.8x | 1 | 11 | 452 |
| FairhillDistrict 7 | District 7 | 19.9 | 2.7x | 5 | 22 | 143 |
| East ParksideDistrict 3 | District 3 | 18.5 | 2.5x | 0 | 7 | 109 |
| BelmontDistrict 3 | District 3 | 17.9 | 2.5x | 1 | 4 | 110 |
| West KensingtonDistrict 7 | District 7 | 17.9 | 2.5x | 2 | 8 | 423 |
| NicetownDistrict 8 | District 8 | 17.4 | 2.4x | 1 | 4 | 86 |
| SharswoodDistrict 5 | District 5 | 17.3 | 2.4x | 0 | 0 | 95 |
| Strawberry MansionDistrict 5 | District 5 | 17.1 | 2.4x | 6 | 22 | 328 |
| Germantown - Penn KnoxDistrict 8 | District 8 | 16.9 | 2.3x | 0 | 3 | 321 |
| HarrowgateDistrict 6 | District 6 | 16.5 | 2.3x | 5 | 4 | 502 |
| HartranftDistrict 5 | District 5 | 16.1 | 2.2x | 5 | 25 | 601 |
| McGuireDistrict 7 | District 7 | 15.8 | 2.2x | 1 | 5 | 72 |
| Mill CreekDistrict 3 | District 3 | 15.8 | 2.2x | 1 | 5 | 280 |
| Hunting ParkDistrict 7 | District 7 | 15.5 | 2.1x | 6 | 16 | 486 |
| HaddingtonDistrict 4 | District 4 | 15.3 | 2.1x | 6 | 28 | 447 |
| North CentralDistrict 5 | District 5 | 15.0 | 2.1x | 4 | 24 | 872 |
| FrankfordDistrict 7 | District 7 | 14.7 | 2.0x | 2 | 28 | 675 |
| Upper KensingtonDistrict 7 | District 7 | 14.7 | 2.0x | 4 | 20 | 661 |
| PaschallDistrict 2 | District 2 | 14.5 | 2.0x | 3 | 11 | 423 |
| West PoplarDistrict 5 | District 5 | 14.3 | 2.0x | 2 | 12 | 211 |
North Philadelphia: Stanton, Strawberry Mansion and North Broad Street
More than half of the avoid neighborhoods are in North Philadelphia. Stanton, west of Broad Street between Diamond Street and Lehigh Avenue, has the highest rate of any Philadelphia neighborhood with 3,000 or more residents, 26.4 per 1,000. It also had more homicides (8) and more shooting victims (33) than any other neighborhood. Strawberry Mansion (17.1) lies west of it, along Ridge Avenue and 29th to 33rd Streets up to East Fairmount Park, and Glenwood (22.3) lies north of it, between Lehigh and Allegheny Avenues.
South of Stanton, North Central (15.0) covers the blocks west of Broad Street around Cecil B. Moore Avenue, and Sharswood (17.3) the blocks around Ridge Avenue and 24th Street. Hartranft (16.1), east of Broad, holds Temple University’s main campus, where Temple’s own police patrol alongside the city’s. North of Allegheny Avenue the avoid tier continues through Franklinville (21.8), Tioga (20.1), Nicetown (17.4) along Germantown Avenue, and Hunting Park (15.5), which recorded 6 homicides.
Kensington, Fairhill and Harrowgate
Kensington Avenue, under the elevated L, is the edge between Upper Kensington (14.7) and Harrowgate (16.5). Upper Kensington recorded 326 violent crimes, and its busiest blocks were the 2700 to 3100 blocks of Kensington Avenue near Allegheny Avenue. West Kensington (17.9), McGuire (15.8) and Fairhill (19.9) fill the blocks west toward 6th Street. Fairhill, with 4,885 residents, recorded 22 shooting victims. The Kensington section below covers the drug market and the police response.
West and Southwest Philadelphia: Haddington, Mill Creek and Paschall
Haddington (15.3) spreads north of Market Street from 52nd Street to 63rd Street along Haverford Avenue and Vine Street. It recorded more firearm aggravated assaults than any other neighborhood, and 28 people were shot there. Mill Creek (15.8) sits east of it around 48th and Parrish Streets. Belmont (17.9), Haverford North (29.1) and East Parkside (18.5) are small neighborhoods near Lancaster Avenue and Girard Avenue, between Mill Creek and West Fairmount Park. Haverford North has only 1,476 residents, and more of its violent crimes were on the 4000 block of Lancaster Avenue than on any other block.
Paschall (14.5) is in Southwest Philadelphia along Woodland Avenue around 65th Street, south of Kingsessing.
Frankford and Germantown
Frankford recorded 357 violent crimes, the most of any neighborhood in the city, and 28 shooting victims. With 24,232 residents its rate is 14.7, the highest in the Northeast. Much of the violence was on Frankford Avenue, under the L between the Frankford Transportation Center at the end of the line and the blocks to the south.
Germantown – Penn Knox (16.9) is the commercial center of Germantown, where Chelten Avenue meets Germantown Avenue. Its 2,075 residents share it with a busy shopping strip, and theft (311) far outnumbers violent crime (35).
Center City East, the Riverfront and West Poplar
Center City East is the official name of the small neighborhood that runs east from City Hall between Market and Vine Streets, with Reading Terminal Market, the Convention Center and the Fashion District mall. It has the highest rate on the map, 48.8, from 61 violent crimes among 1,250 residents. Theft is far more common: it recorded 488 thefts.
The Riverfront (32.2) is the strip between Columbus Boulevard and the Delaware River, from Penn’s Landing south past the big-box stores of South Philadelphia. Most of its 862 thefts were on the shopping blocks of South Columbus Boulevard. West Poplar (14.3) lies between Spring Garden Street and Girard Avenue just east of Broad Street.
Areas to be careful in
The 14 neighborhoods in this tier have 10 to 14 violent crimes per 1,000 residents. Add them to the avoid tier and the two together hold 25% of residents, 51% of violent crime and 63% of shooting victims. Richmond, Allegheny West, Logan, Kingsessing and Mantua border the avoid areas. Washington Square West (12.4) is the one caution neighborhood in Center City between Vine and South Streets: it covers the blocks from Broad Street to 8th Street between Market and South Streets, including the Gayborhood and Jefferson’s hospital campus, and recorded 1,346 thefts.
| Neighborhood | Council district | Violent crimes per 1,000 | vs. city avg | Homicides | Shooting victims | Thefts + robberies |
|---|---|---|---|---|---|---|
| Allegheny WestDistrict 4 | District 4 | 13.4 | 1.8x | 4 | 24 | 382 |
| WisterDistrict 8 | District 8 | 13.1 | 1.8x | 0 | 2 | 89 |
| CallowhillDistrict 1 | District 1 | 12.7 | 1.8x | 0 | 2 | 119 |
| RichmondDistrict 6 | District 6 | 12.4 | 1.7x | 5 | 10 | 1,297 |
| Washington Square WestDistrict 1 | District 1 | 12.4 | 1.7x | 0 | 1 | 1,418 |
| MantuaDistrict 3 | District 3 | 12.1 | 1.7x | 1 | 2 | 242 |
| EastwickDistrict 2 | District 2 | 11.7 | 1.6x | 1 | 3 | 357 |
| KingsessingDistrict 3 | District 3 | 11.7 | 1.6x | 4 | 19 | 351 |
| LoganDistrict 8 | District 8 | 11.6 | 1.6x | 3 | 23 | 387 |
| Walnut HillDistrict 3 | District 3 | 11.5 | 1.6x | 1 | 0 | 157 |
| LudlowDistrict 5 | District 5 | 11.3 | 1.6x | 0 | 2 | 128 |
| BrewerytownDistrict 5 | District 5 | 11.2 | 1.5x | 4 | 11 | 383 |
| Southwest GermantownDistrict 8 | District 8 | 11.2 | 1.5x | 0 | 6 | 176 |
| Carroll ParkDistrict 4 | District 4 | 10.8 | 1.5x | 0 | 13 | 180 |
Is Center City Philadelphia safe?
Yes. Taken together, Center City and the neighborhoods around it from Fairmount to Bella Vista have 6.3 violent crimes per 1,000 residents, below the city rate. Rittenhouse, the main hotel and shopping district, rates average at 5.8 and had no homicides, but it also had more thefts (1,937) than any other neighborhood. Logan Square (5.2), along the Benjamin Franklin Parkway, and Old City (6.6), with Independence Hall and the Liberty Bell, also rate average.
The risk in Center City is theft, and it peaks in daylight. In the Center City planning district, 43% of thefts and robberies happened between noon and 6 p.m., with the peak at 4 p.m.; there were 8 thefts and robberies for every violent crime. Violent crime peaks around 7 p.m., not after the bars close: only 17% happened between midnight and 4 a.m. Market Street east of City Hall is the busiest stretch. In June 2026 the city opened a $1 million public safety hub near 11th and Market Streets, shared by Philadelphia police, SEPTA police, Jefferson police and mall security.
Is Kensington safe?
No. Kensington has no single official boundary; Upper, West, East and Old Kensington together have 13.3 violent crimes per 1,000 residents, and adding Fairhill and Harrowgate raises it to 14.5. Those six neighborhoods recorded 924 violent crimes and 54 shooting victims in 12 months.
The open-air drug market along Kensington Avenue is the reason. By November 2025 the city had about three times as many officers in Kensington as in 2021, mostly on foot, and the 24th Police District counted 46 shootings through mid-November 2025, against 259 in the same period of 2022. The Philadelphia Inquirer reported that the number of people living on the streets fell from about 750 to about 400 between September 2024 and late 2025, and that dealing moved toward Somerset Street rather than ending. East Kensington (7.9) and Old Kensington (4.6), closer to Fishtown, rate far lower than the blocks along the avenue.
Is South Street safe?
Mostly. South Street, the bar and shopping strip that runs west from the Delaware River, divides several neighborhoods. Near the river, Society Hill (1.6) lies north of it and Queen Village (2.9) south; both rate lower risk. West of 6th Street, Bella Vista (1.9) on the south side also rates lower risk. West of 8th Street the north side is Washington Square West, which rates caution at 12.4.
Is SEPTA safe?
SEPTA runs the L (Market-Frankford Line), the B (Broad Street Line), trolleys, buses and Regional Rail, and it has its own police force of about 250 officers. SEPTA reported its lowest level of serious crime in a decade in 2025, with shootings on the system down a third. Visitors mostly ride the L between Old City, Center City and 30th Street Station, and Regional Rail to the airport; the stretches of the L that run above Kensington Avenue and Frankford Avenue pass through avoid neighborhoods. Owl buses replace the L and the B from midnight to 5 a.m.
Philadelphia crime rate
Philadelphia police recorded 11,935 violent crimes between November 2025 and October 2026, 7.3 per 1,000 residents, and 722 shooting victims, 162 of them killed. Robberies fell 9% and firearm aggravated assaults 15% in a year. The city counted 222 homicides in calendar 2025, down from 269 in 2024 and the fewest in about six decades.
Of the 10 City Council districts, District 7, which covers Upper and West Kensington, Fairhill and Hunting Park, has the highest violent crime rate, 12.9 per 1,000, just ahead of District 5 in North Philadelphia at 12.5. District 10 in the far Northeast has the lowest, 1.8. By part of town, North Philadelphia has 11.3 violent crimes per 1,000 residents and the Northeast 4.2.
Car break-ins and car theft in Philadelphia
Police recorded 9,122 thefts from vehicles in 12 months, 20% of all thefts, and 13,664 stolen vehicles. North Central, next to Temple, had the most break-ins, followed by Northern Liberties, which rates average for violent crime. Fishtown and Mayfair are also in the top five. Oxford Circle in the Northeast, a lower-risk neighborhood for violent crime, had the most stolen vehicles. Thefts from vehicles fell 7% and vehicle thefts 8%. Park in a garage in Center City and leave nothing in sight on the street.
Safest neighborhoods to stay in Philadelphia
Society Hill and Fitler Square have the lowest rates in and around Center City, both 1.6 violent crimes per 1,000 residents. Society Hill is a walk from Independence Hall and Penn’s Landing; Fitler Square lies between Rittenhouse and the Schuylkill River. Queen Village, Bella Vista and Graduate Hospital put you near South Street and the Italian Market. Fishtown has bars and restaurants on Frankford Avenue and rates lower risk. University City, with Penn’s campus and 30th Street Station, rates 3.9.
| Neighborhood | Council district | Violent crimes per 1,000 | vs. city avg | Homicides | Shooting victims | Thefts + robberies |
|---|---|---|---|---|---|---|
| Society HillDistrict 1 | District 1 | 1.6 | 0.2x | 0 | 0 | 177 |
| Fitler SquareDistrict 2 | District 2 | 1.6 | 0.2x | 0 | 0 | 35 |
| Bella VistaDistrict 1 | District 1 | 1.9 | 0.3x | 1 | 0 | 139 |
| Graduate HospitalDistrict 2 | District 2 | 2.0 | 0.3x | 1 | 1 | 935 |
| Queen VillageDistrict 1 | District 1 | 2.9 | 0.4x | 0 | 3 | 122 |
| FairmountDistrict 5 | District 5 | 3.8 | 0.5x | 0 | 1 | 160 |
| FishtownDistrict 1 | District 1 | 3.8 | 0.5x | 0 | 1 | 765 |
| University CityDistrict 3 | District 3 | 3.9 | 0.5x | 1 | 3 | 754 |
| RittenhouseDistrict 2 | District 2 | 5.8 | 0.8x | 0 | 0 | 2,024 |
| Old CityDistrict 1 | District 1 | 6.6 | 0.9x | 0 | 0 | 433 |
In the Northwest, Manayunk (1.0), with its Main Street shops, and Chestnut Hill (1.4), along the top of Germantown Avenue, rate among the lowest in the city.
Upper Darby, Cherry Hill and the suburbs
The suburban departments in the table reported 1.91 violent crimes per 1,000 residents together in 2025, against 8.31 for Philadelphia in the same FBI data. Chester, in Delaware County, rates highest of them; Abington rates lowest. Camden is not listed because its FBI reports stop in February 2026.
| City | Population | Violent crimes | Per 1,000 | Year |
|---|---|---|---|---|
| Philadelphia | 1,562,379 | 12,979 | 8.3 | 2025 |
| Chester | 34,402 | 170 | 4.9 | 2025 |
| Cheltenham | 39,204 | 136 | 3.5 | 2025 |
| Upper Darby | 86,160 | 197 | 2.3 | 2025 |
| Bristol Township | 54,120 | 85 | 1.6 | 2025 |
| Cherry Hill (NJ) | 80,020 | 122 | 1.5 | 2025 |
| Gloucester Township (NJ) | 67,054 | 55 | 0.8 | 2025 |
| Abington | 59,217 | 38 | 0.6 | 2025 |
Murder, rape, robbery and aggravated assault reported to the FBI by each agency, per 1,000 residents of the population the agency reports. Source: FBI Crime Data Explorer. Agencies that report no complete year are left out.
Philadelphia safety tips for visitors
- Stay in Center City, Society Hill, Old City, Queen Village, Fitler Square or Fishtown, and check this map before booking a short-term rental further out.
- Keep your phone and wallet in a front pocket on Market Street, at Reading Terminal Market and in the Fashion District.
- Do not walk Kensington Avenue, and treat the L stops from Huntingdon to Allegheny as places to stay on the train.
- Lock your car and leave nothing visible, including in Northern Liberties, Fishtown and around Temple.
- For games at the Sports Complex, take the B to NRG Station and leave with the crowd.
- Call 911 in an emergency and 311 to report a crime that is not an emergency.
How this map was made
The crime counts are the Philadelphia Police Department’s public incident records from November 2025 to October 2026. Violent crime is homicide, rape, robbery and aggravated assault. Homicides are counted per victim and the other crimes per incident, so an assault with several victims counts once. The shooting column is the police department’s shooting victims dataset, which counts every person shot. Each crime is placed in the neighborhood that holds its block location. Reports logged at the address of a police station or a hospital entrance, such as Temple University Hospital, count in the citywide totals but not in any neighborhood. Population is the 2020 Census count by block.
The neighborhoods are the 159 Philadelphia neighborhood boundaries published on OpenDataPhilly, with their official names. The tiers are Avoid (14 or more violent crimes per 1,000 residents), Use caution (10 to 14), Average (5 to 10) and Lower risk (under 5). Crimes handled by SEPTA Transit Police, the Penn, Drexel and Temple university police, the Pennsylvania State Police on the expressways and the park rangers at Independence National Historical Park may be missing. The theft layer counts thefts and robberies, not rates.
We built the same map for the areas to avoid in Chicago, the areas to avoid in New York City, the areas to avoid in San Francisco, the areas to avoid in Los Angeles, the areas to avoid in Miami, the areas to avoid in Atlanta, the areas to avoid in Baltimore, the areas to avoid in Detroit and the areas to avoid in Austin.
FAQ
Is Philadelphia safe to visit?
Yes. Philadelphia had 7.3 violent crimes per 1,000 residents in the 12 months to October 2026, and Center City as a whole rates below that. The violence is concentrated in North Philadelphia, Kensington and parts of West Philadelphia, away from the historic district and the main hotels. Theft on Market Street and car break-ins are the risks most visitors face.
What areas of Philadelphia should you avoid?
The 26 neighborhoods with 14 or more violent crimes per 1,000 residents are Stanton, Strawberry Mansion, Sharswood, North Central, Glenwood, Hartranft, Franklinville, Tioga, Nicetown and Hunting Park in North Philadelphia; Upper Kensington, West Kensington, Fairhill, McGuire and Harrowgate; Haddington, Mill Creek, Belmont, East Parkside, Haverford North and Paschall in the west and southwest; Frankford; Germantown - Penn Knox; and Center City East, West Poplar and the Riverfront.
What is the most dangerous neighborhood in Philadelphia?
Among neighborhoods with 3,000 or more residents, Stanton in North Philadelphia has the highest violent crime rate, 26.4 per 1,000, and it had the most homicides and shooting victims. Frankford recorded the most violent crimes in total, 357. Center City East has a higher rate, but it comes from crowds on Market Street, not residents.
Is Kensington Avenue dangerous?
Yes. Kensington Avenue runs between Upper Kensington and Harrowgate, both avoid neighborhoods, and its blocks near Allegheny Avenue are the center of the city's open-air drug market. Upper Kensington recorded 326 violent crimes in 12 months.
Is Old City Philadelphia safe?
Yes. Old City, with Independence Hall and the Liberty Bell, rates average at 6.6 violent crimes per 1,000 residents, and theft is its most common crime. Society Hill, just south of it, has the lowest rate in and around Center City.
Where is the safest place to stay in Philadelphia?
Society Hill and Fitler Square have the lowest violent crime rates in and around Center City, both 1.6 per 1,000 residents. Queen Village, Bella Vista, Graduate Hospital and Fishtown also rate lower risk. Rittenhouse, the main hotel district, rates average, with theft as the main risk.
Is University City safe?
University City, around Penn and 30th Street Station, rates lower risk at 3.9 violent crimes per 1,000 residents. Penn's police patrol the campus and nearby blocks alongside the city police. Haverford North, Belmont and Mill Creek, further north and west, rate avoid.
Are the Philadelphia suburbs safer than the city?
Yes. The suburban departments in the table reported 1.91 violent crimes per 1,000 residents together in 2025, against 8.31 for Philadelphia. Chester rates highest of them and Abington lowest.