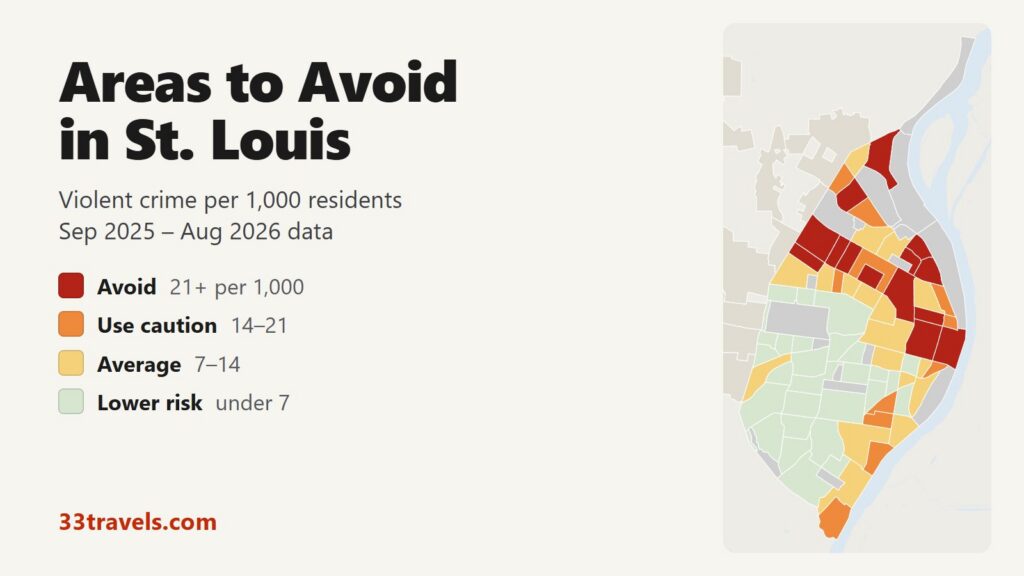
The areas to avoid in St. Louis are on the North Side, from JeffVanderLou and Hyde Park out to Wells Goodfellow at the western city limit and Baden at the northern tip, plus Downtown, Downtown West and Carr Square in the center. From September 2025 to August 2026, 14 neighborhoods had 21 or more violent crimes per 1,000 residents, roughly double the city figure of 10.1. They house 14% of St. Louis residents but recorded 34% of its violent crime and 37 of its 125 homicides.
Neighborhoods to avoid in St. Louis: Downtown, Downtown West and Carr Square in the center. JeffVanderLou, Hyde Park, College Hill and Fairground Neighborhood on the Near North Side. The Ville and Kingsway East near the Greater Ville. Wells Goodfellow, Hamilton Heights and Kingsway West on the northwest edge. Baden and Walnut Park East at the far north end of the city.
St. Louis has a higher violent crime rate than Philadelphia and about two and a half times Austin’s, and its homicide rate of 41.4 per 100,000 residents is almost four times Philadelphia’s. Downtown and Downtown West are the exception among the avoid areas: about 5,000 people live in each, while ballgames, concerts, conventions and office crowds fill them every day, so a rate per resident runs high. The rest of the list is residential North Side neighborhoods with few hotels or attractions. Violent crime fell 12% and homicides 9% against the previous 12 months.
St. Louis safety map
Each neighborhood is colored by its violent crime rate: red for avoid, orange for caution, yellow for average and green for lower risk. Grey marks parks, cemeteries and industrial land with too few residents for a rate, and the beige towns on the edge, such as University City, Clayton and Wellston, have their own police departments. The buttons zoom to Downtown & Near South Side, North City, South City or Central Corridor & West End. Switch to the Theft & robbery layer to see where thefts and robberies happen, and select any neighborhood for its full counts.
Violent crimes per 1,000 residents
Thefts & robberies per area
Tap or hover a neighborhood to see its numbers.
Table of Contents
- Areas to avoid in St. Louis
- Areas to be careful in
- Is downtown St. Louis safe?
- Is the Central West End safe?
- Is Soulard safe?
- Are Forest Park and The Grove safe?
- Is MetroLink safe?
- St. Louis crime rate
- Car break-ins and car theft in St. Louis
- Safest neighborhoods to stay in St. Louis
- St. Louis County and the suburbs
- St. Louis safety tips for visitors
- How this map was made
- FAQ
Areas to avoid in St. Louis
The table lists the 14 neighborhoods at or above 21 violent crimes per 1,000 residents. All but Downtown and Downtown West are north of the city center. Most are small: only Downtown, Downtown West and Baden have more than 5,000 residents.
| Neighborhood | Ward | Violent crimes per 1,000 | vs. city avg | Homicides | Aggravated assaults | Thefts + robberies |
|---|---|---|---|---|---|---|
| Wells GoodfellowWard 13 | Ward 13 | 32.6 | 3.2x | 4 | 127 | 133 |
| Hamilton HeightsWard 13 | Ward 13 | 31.6 | 3.1x | 0 | 49 | 59 |
| College HillWard 14 | Ward 14 | 27.4 | 2.7x | 4 | 20 | 30 |
| Downtown WestWard 14 | Ward 14 | 26.8 | 2.7x | 4 | 103 | 431 |
| JeffVanderLouWard 11 | Ward 11 | 26.6 | 2.6x | 0 | 96 | 146 |
| DowntownWard 8 | Ward 8 | 24.8 | 2.5x | 2 | 103 | 463 |
| BadenWard 13 | Ward 13 | 24.0 | 2.4x | 7 | 99 | 148 |
| Hyde ParkWard 14 | Ward 14 | 23.3 | 2.3x | 1 | 47 | 69 |
| Walnut Park EastWard 13 | Ward 13 | 22.5 | 2.2x | 3 | 52 | 70 |
| Kingsway WestWard 12 | Ward 12 | 21.9 | 2.2x | 4 | 41 | 43 |
| The VilleWard 12 | Ward 12 | 21.7 | 2.2x | 3 | 19 | 51 |
| Fairground NeighborhoodWard 11 | Ward 11 | 21.6 | 2.1x | 1 | 18 | 33 |
| Kingsway EastWard 12 | Ward 12 | 21.6 | 2.1x | 0 | 40 | 72 |
| Carr SquareWard 14 | Ward 14 | 21.5 | 2.1x | 4 | 36 | 52 |
Downtown, Downtown West and Carr Square
Downtown runs from the riverfront and the Gateway Arch west to Tucker Boulevard, between Cole Street and Chouteau Avenue, and holds Busch Stadium. Downtown West continues from Tucker to Jefferson Avenue and holds City Hall, Union Station, the Enterprise Center, CityPark and the City Museum. Their rates, 24.8 and 26.8, count only the 5,442 and 5,115 people who live there. Theft is the main risk: Downtown recorded 441 thefts against 135 violent crimes, and Downtown West 411 against 137. After the Central West End, these two had more thefts than any other neighborhood.
Carr Square (21.5) lies just north of Downtown West, a residential area of 2,236 people that recorded 4 homicides.
JeffVanderLou, Hyde Park, College Hill and Fairground
JeffVanderLou (26.6) starts at the northwest edge of Downtown West and runs up to Natural Bridge Avenue, with North Vandeventer Avenue on its west side. With 4,209 residents it recorded 112 violent crimes, 96 of them aggravated assaults. Hyde Park (23.3) and College Hill (27.4) sit further north, beside the Near North Riverfront, and Fairground Neighborhood (21.6) borders Fairground Park between them and JeffVanderLou. College Hill has 1,243 residents and recorded 4 homicides.
The Ville and Kingsway East
The Ville (21.7), bounded by St. Louis Avenue, North Sarah Street, Dr. Martin Luther King Drive and North Taylor Avenue, sits on the west side of the Greater Ville. Kingsway East (21.6) lies a few blocks northwest, past Lewis Place. The May 2025 EF3 tornado hit both areas hard: Kingsway East, the Greater Ville, Fountain Park, Academy and Penrose took the worst damage, and the rates here divide by the 2020 population, counted before the storm.
Wells Goodfellow, Hamilton Heights and Kingsway West
Wells Goodfellow has the highest rate in St. Louis, 32.6 violent crimes per 1,000 residents. It sits against the western city limit, between Natural Bridge Avenue and Dr. Martin Luther King Drive, and its 4,473 residents saw 146 violent crimes, second only to Dutchtown in the raw count. Hamilton Heights, just south of it, has the second-highest rate (31.6), and Kingsway West (21.9) borders it to the east.
Baden and Walnut Park East
Baden (24.0) is the city’s northern tip, between Riverview Boulevard and Hall Street, up to Maline Creek and the city limit. It recorded 131 violent crimes and 7 homicides. Walnut Park East (22.5) lies west of Bellefontaine and Calvary cemeteries, which separate it from Baden. Walnut Park West, next door, rates caution at 20.3 and recorded 6 homicides.
Areas to be careful in
These 11 neighborhoods have 14 to 21 violent crimes per 1,000 residents. With the avoid areas they make up 25% of the city’s population and 51% of its violent crime. Six are North Side neighborhoods next to the avoid areas, including the Greater Ville, which recorded more homicides than any other neighborhood (10). Four are on the South Side: Gravois Park, Benton Park West and Mount Pleasant, which has the highest rate in South City, plus Patch at the southern tip. LaSalle Park, just south of Downtown, has only 1,088 residents and more thefts (79) than violent crimes (19).
| Neighborhood | Ward | Violent crimes per 1,000 | vs. city avg | Homicides | Aggravated assaults | Thefts + robberies |
|---|---|---|---|---|---|---|
| Mark TwainWard 12 | Ward 12 | 20.9 | 2.1x | 2 | 52 | 57 |
| Old North St. LouisWard 14 | Ward 14 | 20.8 | 2.1x | 6 | 18 | 59 |
| Walnut Park WestWard 13 | Ward 13 | 20.3 | 2.0x | 6 | 43 | 74 |
| LaSalle ParkWard 8 | Ward 8 | 17.5 | 1.7x | 0 | 16 | 82 |
| Mount PleasantWard 3 | Ward 3 | 16.8 | 1.7x | 6 | 52 | 140 |
| Gravois ParkWard 7 | Ward 7 | 16.7 | 1.7x | 1 | 62 | 151 |
| Benton Park WestWard 7 | Ward 7 | 16.3 | 1.6x | 2 | 57 | 111 |
| Fountain ParkWard 10 | Ward 10 | 15.8 | 1.6x | 0 | 12 | 26 |
| PatchWard 1 | Ward 1 | 15.8 | 1.6x | 1 | 39 | 120 |
| Columbus SquareWard 14 | Ward 14 | 15.2 | 1.5x | 1 | 27 | 68 |
| Greater VilleWard 12 | Ward 12 | 15.0 | 1.5x | 10 | 41 | 127 |
Is downtown St. Louis safe?
Yes, during the day and around events. The Gateway Arch grounds, Busch Stadium, the convention center and Union Station draw crowds all day, and most crime there is theft. The two neighborhoods rank second and third in the city for thefts from vehicles, behind Forest Park. Thefts and robberies across the Downtown & Near South Side part of the map peak at 6 p.m. Violence peaks later, in the hour after midnight, and 21% of violent crimes there happened between midnight and 4 a.m.
A fatal shooting inside a Washington Avenue bar on May 17, 2026 led residents to ask for weekend street closures. After teenage street takeovers, the city put Downtown and Downtown West under a 10 p.m. curfew for minors in March 2026 and a 9 p.m. curfew from July 3 to Labor Day. At the Arch, National Park Service rangers share jurisdiction with city police.
Is the Central West End safe?
Yes. The Central West End, between Delmar Boulevard, Vandeventer Avenue, I-64 and Kingshighway, has 16,670 residents and a rate of 4.9 per 1,000, below half the city figure. It holds hotels, restaurant streets and the Barnes-Jewish and Washington University medical campus, and it recorded more thefts than any other neighborhood in St. Louis, 541. The medical center pays for extra patrols in the Central West End and Forest Park Southeast. Its northern edge borders Fountain Park, a caution area.
The Delmar Loop, the music and restaurant strip on Delmar Boulevard at the city’s western edge, is mostly in University City, which has its own police, so its crime is not in these numbers.
Is Soulard safe?
Mostly. Soulard, the triangle of brick rowhouses and bars between I-55 and South 7th Street and Broadway, rates average at 9.4 per 1,000, but it recorded 5 homicides among 3,831 residents and 201 thefts, more than half of them from parked cars. Mardi Gras, which ran from January 6 to February 17 in 2026 with the Grand Parade on February 14, fills the streets with parked cars, and SLMPD put uniformed and plain-clothes officers on the 2026 celebration. Benton Park, west across I-55, rates lower (5.9).
Are Forest Park and The Grove safe?
Forest Park, home to the Saint Louis Zoo and the Saint Louis Art Museum, recorded 8 violent crimes. It led the city in thefts from vehicles, which made up most of its 213 thefts. City police and the Park Rangers, an SLMPD unit based in the park, patrol it every day.
The Grove, the bar and restaurant strip on Manchester Avenue, is in Forest Park Southeast, which rates lower risk at 6.7. The neighborhood lies between I-64, Vandeventer, I-44 and Kingshighway, south of the medical campus.
Is MetroLink safe?
MetroLink, the light rail line that links Lambert Airport, Forest Park, the Central West End, Union Station and Downtown, has no police force of its own. Metro lists 40 public safety officers, about 130 contracted security and fare enforcement staff and 68 police officers and deputies from St. Louis County, St. Louis City and St. Clair County assigned to the system. Metro’s public safety text line, 314-300-0188, is staffed around the clock. City data leaves out crimes that county agencies record on MetroLink. Ride in a car with other passengers at night and keep your phone out of sight near the doors.
St. Louis crime rate
The St. Louis Metropolitan Police Department recorded 3,255 violent crimes between September 2025 and August 2026, or 10.1 per 1,000 residents, and 125 homicide victims. Against the 12 months before, robberies fell 23%, aggravated assaults 11% and homicides 9%. SLMPD’s year-end report counted 140 homicides in 2025, down from 151 in 2024 and 263 in 2020.
North City, the part of the map north of the central corridor, has 19.8 violent crimes per 1,000 residents, three times South City’s 6.4. The Central Corridor & West End is lowest at 5.6. Dutchtown recorded more violent crimes than any other neighborhood, 201, but with 15,356 residents it is the second most populous neighborhood in the city and rates average.
Car break-ins and car theft in St. Louis
Police logged 3,010 thefts from vehicles in 12 months, 36% of all thefts, plus 1,177 thefts of vehicle parts and 2,943 stolen vehicles. Break-ins are most common where visitors park: Forest Park had the most, followed by Downtown and Downtown West. Stolen cars are spread across the residential south side: Dutchtown led with 217, then Tower Grove South. Both fell over the year, break-ins by 17% and vehicle thefts by 15%. Empty the car completely, including the trunk, before parking at Forest Park or downtown.
Safest neighborhoods to stay in St. Louis
Lafayette Square has the lowest rate on the Downtown map view, 2.3 per 1,000, with houses around Lafayette Park, next to Downtown West. The Hill, the Italian neighborhood south of Manchester Avenue, and Shaw, next to the Missouri Botanical Garden, are both under 3. Tower Grove South runs from South Grand to Kingshighway below Tower Grove Park, and Compton Heights, next to Shaw, has the lowest rate in South City. DeBaliviere Place and Skinker-DeBaliviere border Forest Park on the north, and the Central West End puts hotels within walking distance of the park.
| Neighborhood | Ward | Violent crimes per 1,000 | vs. city avg | Homicides | Aggravated assaults | Thefts + robberies |
|---|---|---|---|---|---|---|
| Lafayette SquareWard 8 | Ward 8 | 2.3 | 0.2x | 0 | 2 | 53 |
| The HillWard 5 | Ward 5 | 2.8 | 0.3x | 0 | 6 | 84 |
| ShawWard 6 | Ward 6 | 2.5 | 0.3x | 0 | 15 | 137 |
| Compton HeightsWard 6 | Ward 6 | 0.7 | 0.1x | 0 | 1 | 34 |
| Tower Grove SouthWard 6 | Ward 6 | 3.8 | 0.4x | 3 | 35 | 293 |
| Benton ParkWard 8 | Ward 8 | 5.9 | 0.6x | 0 | 17 | 82 |
| Central West EndWard 9 | Ward 9 | 4.9 | 0.5x | 4 | 50 | 560 |
| DeBaliviere PlaceWard 10 | Ward 10 | 3.6 | 0.4x | 0 | 10 | 83 |
| Skinker DeBaliviereWard 10 | Ward 10 | 2.1 | 0.2x | 1 | 4 | 73 |
| St. Louis HillsWard 2 | Ward 2 | 1.3 | 0.1x | 0 | 6 | 176 |
St. Louis Hills, in the southwest of the city, has one of the lowest rates in the city at 1.3.
St. Louis County and the suburbs
St. Louis is an independent city, separate from St. Louis County, and the suburbs report far fewer violent crimes to the FBI. The six suburban departments in the table reported 3.25 violent crimes per 1,000 residents in 2025, against 12.31 for the city in the same FBI data. O’Fallon and Chesterfield are lowest. Belleville, across the river in Illinois, is highest of the suburbs.
| City | Population | Violent crimes | Per 1,000 | Year |
|---|---|---|---|---|
| St. Louis | 274,819 | 3,384 | 12.3 | 2025 |
| Belleville (IL) | 40,142 | 193 | 4.8 | 2025 |
| St. Louis County (unincorporated) | 400,341 | 1,761 | 4.4 | 2025 |
| St. Charles | 72,881 | 134 | 1.8 | 2025 |
| St. Peters | 62,360 | 107 | 1.7 | 2025 |
| Chesterfield | 49,345 | 59 | 1.2 | 2025 |
| O'Fallon (MO) | 96,304 | 94 | 1.0 | 2025 |
Murder, rape, robbery and aggravated assault reported to the FBI by each agency, per 1,000 residents of the population the agency reports. Source: FBI Crime Data Explorer. Agencies that report no complete year are left out.
St. Louis safety tips for visitors
- Leave nothing in your car at Forest Park lots, downtown garages and Soulard during Mardi Gras. Thefts from vehicles are the largest category of theft in St. Louis.
- Leave Washington Avenue before bar close and take a rideshare from a side street.
- Stay in the Central West End, Lafayette Square, near Forest Park or downtown near the Arch.
- Text Metro public safety at 314-300-0188 for trouble on MetroLink or MetroBus.
- Call 9-1-1 in an emergency and 314-231-1212 for the police non-emergency line.
How this map was made
The counts come from the St. Louis Metropolitan Police Department’s monthly NIBRS crime files for September 2025 through August 2026. Violent crime is murder, rape and other forcible sex offenses, robbery and aggravated assault. Homicides, rapes and aggravated assaults are counted once per victim, as the FBI counts them. SLMPD reissues an incident in later files each time it is updated, so only the newest version of each incident is counted; on that basis calendar 2025 matches the FBI’s homicide total for the city and is within 5% of its violent crime total. Each crime is placed in a neighborhood by its map point.
The neighborhoods are the city’s 79 official neighborhoods; its large parks are shown but not rated. Population is the 2020 Census count by block. The tiers are Avoid (21 or more violent crimes per 1,000 residents), Use caution (14 to 21), Average (7 to 14) and Lower risk (under 7). Neighborhoods with fewer than 1,000 residents get no rate. Another 443 reports, taken at the City Justice Center jail, hospitals and police buildings, count toward the city total but not toward any neighborhood. Crimes handled by campus police at Saint Louis University and Washington University, and by county agencies on MetroLink, may be missing. Lambert Airport is in St. Louis County and outside the city data. The suburban table uses each department’s reports to the FBI’s Crime Data Explorer. The FBI’s rate for the city is higher than the map’s because it divides by a 2025 population estimate of 274,819 instead of the 2020 Census count.
We built the same map for the areas to avoid in Chicago, the areas to avoid in New York City, the areas to avoid in San Francisco, the areas to avoid in Los Angeles, the areas to avoid in Miami, the areas to avoid in Atlanta, the areas to avoid in Baltimore, the areas to avoid in Detroit, the areas to avoid in Austin, the areas to avoid in Philadelphia and the areas to avoid in Boston.
FAQ
Is St. Louis safe to visit?
Yes, for the places most visitors go. The Arch grounds, Forest Park, the Central West End, The Hill and Soulard all sit outside the avoid areas, and the violence that gives St. Louis its reputation is concentrated in North Side residential neighborhoods. The city as a whole had 10.1 violent crimes per 1,000 residents in the 12 months to August 2026. Car break-ins are the most common theft.
What areas of St. Louis should you avoid?
The 14 neighborhoods at 21 or more violent crimes per 1,000 residents are Wells Goodfellow, Hamilton Heights, Kingsway West, Kingsway East, The Ville, JeffVanderLou, Hyde Park, College Hill, Fairground Neighborhood, Baden, Walnut Park East and Carr Square on the North Side, plus Downtown and Downtown West. The two downtown areas rate high because few people live there and crowds visit every day.
What is the most dangerous neighborhood in St. Louis?
Wells Goodfellow, on the western city limit, has the highest violent crime rate at 32.6 per 1,000 residents. Dutchtown on the South Side recorded the most violent crimes, 201, but it has 15,356 residents, so its rate is average. The Greater Ville recorded the most homicides, 10.
Is it safe to walk around downtown St. Louis at night?
Around the ballpark, the Arch and the hotels before midnight, yes. Downtown's violent crime peaks in the hour after midnight, and a fatal shooting inside a Washington Avenue bar in May 2026 led residents to ask for weekend street closures. Take a rideshare back to your hotel after the bars close.
Where should I stay in St. Louis?
The Central West End (4.9 per 1,000) has hotels, restaurants and a walk to Forest Park. Lafayette Square (2.3) and The Hill (2.8) are quieter residential options. Downtown puts you next to the Arch and Busch Stadium, with more theft.
Is the north side of St. Louis dangerous?
North City has 19.8 violent crimes per 1,000 residents, about three times South City's 6.4, and 11 of the city's 14 avoid areas. O'Fallon and St. Louis Place rate average. Few visitor attractions are there.
Is St. Louis crime going down?
Yes. Violent crime fell 12% and robberies 23% between September 2025 and August 2026 compared with the year before. SLMPD counted 140 homicides in 2025, down from 151 in 2024 and 263 in 2020.