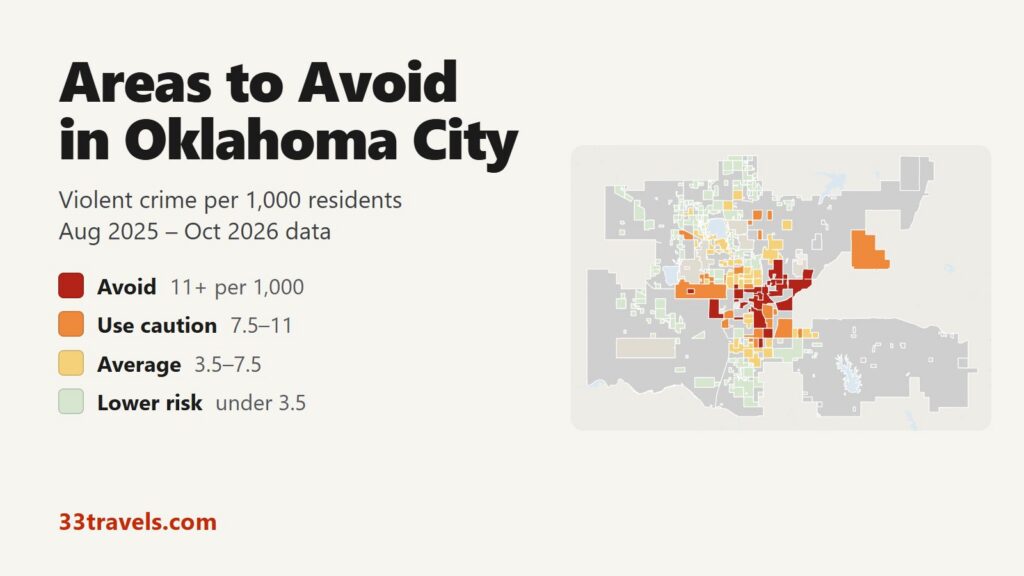
The areas to avoid in Oklahoma City are the downtown core around Bricktown and Paycom Center, Midtown just north of it, the old west side neighborhoods around Stockyards City, the northeast along Martin Luther King Avenue and the south side from Capitol Hill down to I-240. Out west, the Meridian Avenue commercial corridor has the highest rate in the city. In the police department’s neighborhood reports for 12 months between August 2025 and October 2026, 12 neighborhoods logged 11 or more violent crimes per 1,000 residents, double the neighborhood average of 5.6. They house 8% of the city’s residents but account for 36% of the violent crime in the reports, 43% of the robberies and 8 of the 27 homicides.
Neighborhoods to avoid in Oklahoma City: Downtown (with Bricktown and Automobile Alley), City Center and Midtown in the center. Meridian, Miller (with Stockyards City) and Greenvale on the west side. Culbertson East Highland, South Park Estates and the Garden Neighborhood Council area on the northeast side. Capitol Hill, Shields-Davis and Parmelee on the south side.
Oklahoma City has no open crime database, so the map is built from the monthly crime reports OKCPD sends to neighborhood associations. Those reports cover the 66.1% of residents who live inside a registered association and list about half of the department’s offenses. Grey parts of the map have no association and no data. The three downtown areas rank high because few people live there and crowds come for games, bars and concerts, so theft is the main risk. Across the city, FBI data shows 4,917 violent crimes in 2025, 6.82 per 1,000 residents. In the reports, violent crime fell 2.8% and car theft 26.3% against the same months a year earlier.
Oklahoma City safety map
Red marks the places to avoid, orange calls for caution, yellow is average and green is below average. Pale grey is city land with no neighborhood association, where the reports carry no crimes. Darker grey with a name is a separate city with its own police, such as Nichols Hills, The Village, Bethany or Del City. The view buttons zoom to Downtown & Midtown, Northwest, North & Northeast, Southwest or South & Southeast. The Theft & robbery layer shows where shoplifting, car break-ins and muggings cluster. Tap or hover over an area for its counts.
Violent crimes per 1,000 residents (association reports)
Thefts & robberies per area
Tap or hover a neighborhood to see its numbers.
Table of Contents
- Areas to avoid in Oklahoma City
- Areas to be careful in
- Is downtown OKC and Bricktown safe?
- Is Midtown safe?
- Is the Plaza District or the Paseo safe?
- Is Stockyards City safe?
- Oklahoma City crime rate
- Car break-ins and car theft
- Safest neighborhoods to stay in Oklahoma City
- Edmond, Norman and the suburbs
- Oklahoma City safety tips
- How this map was made
- FAQ
Areas to avoid in Oklahoma City
The 12 areas below had 11 or more violent crimes per 1,000 residents in the reports. All but Capitol Hill have fewer than 8,000 residents, so a few dozen crimes are enough to put an area on the list.
| Neighborhood | Council ward | Violent crimes per 1,000 (reports) | vs. sample avg | Homicides | Aggravated assaults | Thefts + robberies |
|---|---|---|---|---|---|---|
| MeridianWard 3 | Ward 3 | 37.3 | 6.7x | 1 | 52 | 373 |
| MidtownWard 6 | Ward 6 | 28.1 | 5.0x | 1 | 62 | 165 |
| City CenterWard 6 | Ward 6 | 25.6 | 4.6x | 0 | 37 | 131 |
| DowntownWard 6 | Ward 6 | 24.2 | 4.3x | 1 | 72 | 253 |
| MillerWard 6 | Ward 6 | 18.7 | 3.4x | 0 | 45 | 128 |
| Culbertson East HighlandWard 7 | Ward 7 | 14.4 | 2.6x | 4 | 81 | 207 |
| Shields-DavisWard 4 | Ward 4 | 13.6 | 2.4x | 0 | 27 | 96 |
| ParmeleeWard 4 | Ward 4 | 13.5 | 2.4x | 0 | 26 | 87 |
| Garden Neighborhood CouncilWard 7 | Ward 7 | 13.4 | 2.4x | 0 | 36 | 107 |
| Capitol HillWard 6 | Ward 6 | 12.1 | 2.2x | 0 | 87 | 305 |
| South Park EstatesWard 7 | Ward 7 | 12.0 | 2.2x | 1 | 69 | 119 |
| GreenvaleWard 3 | Ward 3 | 11.0 | 2.0x | 0 | 32 | 46 |
Downtown, City Center and Midtown
City Center is the core of downtown, from NW 6th Street south to Oklahoma City Boulevard and west to Western Avenue. It holds Paycom Center, the Oklahoma City National Memorial, Myriad Botanical Gardens and the county jail. Only 2,536 people live there, and its rate is 25.6 per 1,000. About a fifth of its reports come from one block of NW 5th Street, home to the EMBARK bus transit center.
Downtown, as drawn here, wraps around City Center: Bricktown, Deep Deuce, Automobile Alley, Film Row, the Farmers Market district and Scissortail Park. It recorded 105 violent crimes and 237 thefts with 4,333 residents, a rate of 24.2. City Rescue Mission, a 24-hour shelter, sits on its west edge.
Midtown (28.1) runs from NW 4th Street to NW 13th Street west of Broadway, with the restaurants and bars around NW 10th Street and SSM Health St. Anthony Hospital. About a sixth of Midtown’s reports carry the hospital’s block of North Lee Avenue, which inflates its count.
West side: Meridian, Miller and Greenvale
Meridian has the highest rate in Oklahoma City, 37.3 per 1,000. It covers the commercial corridor on South Meridian Avenue between Reno Avenue and SW 29th Street, lined with hotels and restaurants a few miles north of the airport, and has only 2,651 residents. Thefts (340) far outnumber violent crimes, and it had more thefts from vehicles than any other area.
Miller (18.7) covers the old neighborhoods between May and Pennsylvania Avenues from NW 16th Street south to Reno Avenue, plus Stockyards City along the Oklahoma River. Greenvale (11.0) is a small neighborhood further west, on NW 10th Street at Rockwell Avenue.
Northeast: Culbertson East Highland, South Park Estates and Garden
Culbertson East Highland (14.4) lies east of the OU Health campus, roughly from NE 8th to NE 23rd Street. It had 4 homicides, the most of any area, and 115 violent crimes. South Park Estates (12.0) follows Martin Luther King Avenue from NE 23rd to NE 50th Street, south of the zoo. The Garden Neighborhood Council area (13.4) spreads east from Bryant Avenue toward Sooner Road between Reno Avenue and NE 23rd Street.
South side: Capitol Hill, Shields-Davis and Parmelee
Capitol Hill (12.1) is the large district south of the Oklahoma River, taking in the Wheeler District and the SW 29th Street corridor. With 10,027 residents it is the most populated avoid area, and it had the second-most violent crimes in the city. Shields-Davis (13.6) sits between SE 44th and SE 59th Streets east of Santa Fe Avenue. Parmelee (13.5), between SW 59th Street and I-240 west of Santa Fe, owes much of its count to one block of the I-240 service road.
Areas to be careful in
These 15 areas had 7.5 to 11 violent crimes per 1,000 residents. With the avoid areas they hold 20% of residents and 65% of the violent crime in the reports. The largest is the WesTen District, a business district on West 10th Street with 18,459 residents and more violent crimes, aggravated assaults and stolen vehicles than any other area. Most of the rest are south side neighborhoods next to the avoid areas, such as Lumberman, Southern Oaks and South Walker. Two matter to visitors: Classen-Ten-Penn, which holds the Plaza District, and Northridge, where stores on the Northwest Expressway account for much of its 349 thefts.
| Neighborhood | Council ward | Violent crimes per 1,000 (reports) | vs. sample avg | Homicides | Aggravated assaults | Thefts + robberies |
|---|---|---|---|---|---|---|
| LumbermanWard 4 | Ward 4 | 10.9 | 2.0x | 0 | 37 | 121 |
| Southern OaksWard 4 | Ward 4 | 10.6 | 1.9x | 0 | 22 | 88 |
| WesTen DistrictWard 3 | Ward 3 | 9.7 | 1.7x | 2 | 136 | 390 |
| Chisholm Creek College ParkWard 7 | Ward 7 | 9.6 | 1.7x | 0 | 49 | 105 |
| RockwoodWard 6 | Ward 6 | 9.1 | 1.6x | 3 | 29 | 52 |
| Classen-Ten-PennWard 6 | Ward 6 | 9.0 | 1.6x | 0 | 22 | 68 |
| SequoyahWard 2 | Ward 2 | 8.9 | 1.6x | 1 | 23 | 89 |
| North Highland/Estes ParkWard 2 | Ward 2 | 8.7 | 1.6x | 1 | 14 | 22 |
| Highland ParkWard 4 | Ward 4 | 8.4 | 1.5x | 0 | 17 | 46 |
| Green PasturesWard 7 | Ward 7 | 8.2 | 1.5x | 0 | 16 | 31 |
| NorthridgeWard 1 | Ward 1 | 8.2 | 1.5x | 0 | 19 | 354 |
| South WalkerWard 4 | Ward 4 | 8.2 | 1.5x | 0 | 39 | 100 |
| Windsor AreaWard 2 | Ward 2 | 8.2 | 1.5x | 0 | 33 | 129 |
| Shidler-WheelerWard 4 | Ward 4 | 8.1 | 1.5x | 2 | 55 | 111 |
| AirlineWard 6 | Ward 6 | 8.0 | 1.4x | 1 | 29 | 92 |
Is downtown OKC and Bricktown safe?
Theft is the crime you are most likely to meet downtown. Downtown and City Center together logged 237 and 114 thefts against 105 and 65 violent crimes. Bricktown has its own OKCPD division station on East Main Street, bike patrols and ambassadors, and a 9 p.m. to 6 a.m. curfew for unaccompanied minors in the entertainment district.
The serious incidents came in the evening and at night. A teenager was shot and killed outside the Bricktown movie theater on Reno Avenue at 11:45 p.m. in June 2025. A hotel security guard was killed in a parking lot on North Broadway at 2:40 a.m. in January 2026. In May 2026 police arrested teens with guns near Paycom Center on a Saturday evening. Go to games and shows, then take the streetcar or a rideshare from a busy corner rather than walking empty blocks to a far lot.
Is Midtown safe?
Midtown rates avoid, but the hospital block and a small population lift its count. The restaurant blocks around NW 10th Street and Harvey Avenue are busy in the evening. In May 2025 a shooting outside The Collective food hall at NW 10th and Harvey left nine people hurt, so leave when the bars empty rather than lingering on the sidewalk. Theft (144) outnumbers violent crime (101) here too.
Is the Plaza District or the Paseo safe?
The Plaza District, on NW 16th Street between Classen Boulevard and Penn Avenue, sits inside Classen-Ten-Penn, which rates caution at 9.0 per 1,000. Its galleries, shops and restaurants draw an evening crowd, and the whole Classen-Ten-Penn area logged 28 violent crimes in the period. The Paseo Arts District falls in Jefferson Park, at 3.8, below the neighborhood average. The Mesta Park area, which includes Heritage Hills and Uptown 23rd, sits at the average (5.6), and Epworth, which holds the Asian District on Classen, sits at 6.6.
Is Stockyards City safe?
Stockyards City is part of the Miller avoid area, at 18.7 per 1,000. Most of Miller’s violent crime is in Westlawn Gardens, north of Reno Avenue between May and Pennsylvania Avenues; the Stockyards City associations account for about a quarter. Visit for a meal or the shops and drive between stops after dark.
Oklahoma City crime rate
OKCPD reported 4,917 violent crimes to the FBI for 2025, including 590 robberies and 3,745 aggravated assaults. That is 6.82 per 1,000 residents on the FBI’s population figure. The city’s own homicide count, reported by Mayor David Holt, was 74 in 2025, down from 78 in 2024.
The neighborhood reports point the same way. Against the same months a year earlier, violent crime fell 2.8%, aggravated assault 3.8%, burglary 7% and car theft 26.3%, while robberies rose from 408 to 418. By council ward, Ward 6, which takes in downtown, Midtown and Capitol Hill, has the highest rate in the reports, 10.5 per 1,000. Ward 8, the far north around Quail Springs, has the lowest, 1.4.
Car break-ins and car theft
The reports list 1,713 thefts from vehicles, 24% of all thefts, and 1,163 stolen vehicles. Meridian leads for break-ins, followed by the WesTen District. The Two40 retail strip on I-240 and the Quail Springs Mall area logged 554 and 356 thefts against 61 and 12 violent crimes. Break-ins fell 16.3% in a year. Use the downtown garages for events.
Safest neighborhoods to stay in Oklahoma City
The north side has the lowest rates. Northaven, The Greens and Quail Creek are residential areas north and east of Lake Hefner, and Edgewater/Lakepointe lines the lake’s south shore. Closer in, three areas sit below the neighborhood average: Jefferson Park, which holds the Paseo; Crown Heights, north of NW 36th Street along Western Avenue; and Gatewood, just north of the Plaza District. Nichols Hills, a separate city with its own police almost surrounded by Oklahoma City, reported two violent crimes to the FBI in 2025.
| Neighborhood | Council ward | Violent crimes per 1,000 (reports) | vs. sample avg | Homicides | Aggravated assaults | Thefts + robberies |
|---|---|---|---|---|---|---|
| NorthavenWard 1 | Ward 1 | 1.9 | 0.3x | 0 | 9 | 86 |
| The GreensWard 8 | Ward 8 | 2.4 | 0.4x | 0 | 6 | 32 |
| Quail CreekWard 8 | Ward 8 | 1.1 | 0.2x | 0 | 5 | 48 |
| Quail SpringsWard 8 | Ward 8 | 3.8 | 0.7x | 0 | 9 | 359 |
| Edgewater/LakepointeWard 2 | Ward 2 | 4.9 | 0.9x | 0 | 10 | 299 |
| Crown HeightsWard 2 | Ward 2 | 2.5 | 0.5x | 0 | 7 | 56 |
| Jefferson ParkWard 2 | Ward 2 | 3.8 | 0.7x | 0 | 9 | 46 |
| GatewoodWard 6 | Ward 6 | 4.3 | 0.8x | 0 | 4 | 47 |
Edmond, Norman and the suburbs
Most suburbs report less violent crime than Oklahoma City. The suburban departments in the table together reported 2.69 violent crimes per 1,000 residents in 2025, against 6.82 for OKCPD. Mustang and Edmond have the lowest rates. Del City, the small city wedged against the southeast side, is the exception and runs above Oklahoma City.
| City | Population | Violent crimes | Per 1,000 | Year |
|---|---|---|---|---|
| Del City | 21,141 | 179 | 8.5 | 2025 |
| Oklahoma City | 720,580 | 4,917 | 6.8 | 2025 |
| Shawnee | 32,290 | 156 | 4.8 | 2025 |
| Midwest City | 58,515 | 204 | 3.5 | 2025 |
| Yukon | 27,954 | 82 | 2.9 | 2025 |
| Norman | 131,728 | 321 | 2.4 | 2025 |
| Moore | 64,044 | 147 | 2.3 | 2025 |
| Bethany | 20,323 | 39 | 1.9 | 2025 |
| Edmond | 100,144 | 139 | 1.4 | 2025 |
| Mustang | 25,026 | 26 | 1.0 | 2025 |
Murder, rape, robbery and aggravated assault reported to the FBI by each agency, per 1,000 residents of the population the agency reports. Source: FBI Crime Data Explorer. Agencies that report no complete year are left out.
Oklahoma City safety tips
- Use the OKC Streetcar to get around downtown and Bricktown; it runs until 2 a.m. on Friday and Saturday.
- After Thunder games and concerts, leave with the crowd and meet your ride on a lit, busy street, not on a dark side street.
- Take bags and electronics out of the car at hotels and malls.
- Drive or ride between neighborhoods at night rather than walking long blocks.
- Call 911 in an emergency. OKCPD takes reports that are not emergencies at (405) 231-2121 or through its online report form.
How this map was made
OKCPD does not publish crime records as open data. The counts come from the department’s monthly “Cases As Reported” files for neighborhood associations, published by the Neighborhood Alliance of Central Oklahoma. Each file lists the address block, date, offense and case number of every case inside a registered association. We used the 12 complete files from August 2025 to October 2026 and left out March 2026, June 2026, July 2026, which were cut short. Each case and offense counts once, assigned to the smallest association that lists it. Violent crime means murder, rape and other forcible sex offenses, robbery and aggravated assault. In 2025 the files held 53% of the violent crimes OKCPD reported to the FBI.
The areas are the city’s neighborhood association, homeowners association and business district boundaries, merged where small ones touch until each has about 2,000 residents. Where associations overlap, the smaller one keeps the land. City land outside every association, 33.9% of residents, is grouped by council ward and has no rate. Population is the 2020 Census count by block. Rates compare areas with each other; they undercount the true rate because the files leave out about half of all offenses. Crimes handled by the Highway Patrol at the State Capitol, OU Health Sciences Center police, airport police at Will Rogers World Airport and the security forces at Tinker Air Force Base are not in OKCPD’s files. The suburban table uses each department’s reports to the FBI’s Crime Data Explorer.
We built the same map for the areas to avoid in Chicago, the areas to avoid in New York City, the areas to avoid in San Francisco, the areas to avoid in Los Angeles, the areas to avoid in Miami, the areas to avoid in Atlanta, the areas to avoid in Baltimore, the areas to avoid in Detroit, the areas to avoid in Austin, the areas to avoid in Philadelphia, the areas to avoid in St. Louis, the areas to avoid in Boston, the areas to avoid in Denver, the areas to avoid in Houston, the areas to avoid in San Diego, the areas to avoid in Milwaukee, the areas to avoid in Buffalo, the areas to avoid in Jacksonville, the areas to avoid in Phoenix, the areas to avoid in Honolulu and the areas to avoid in San Antonio.
FAQ
Is Oklahoma City safe to visit?
Yes, for the places visitors go. OKCPD reported 6.82 violent crimes per 1,000 residents to the FBI for 2025. Downtown, City Center and Midtown rank high because few people live there and crowds come for games and bars; theft and car break-ins are the main risks for visitors.
What are the worst neighborhoods in Oklahoma City?
By violent crime per resident in OKCPD's neighborhood reports, the 12 areas to avoid are Meridian, Midtown, City Center, Downtown, Miller, Culbertson East Highland, Shields-Davis, Parmelee, Garden Neighborhood Council, Capitol Hill, South Park Estates and Greenvale. The WesTen District on the west side had the most violent crimes in total, 179, but its larger population keeps its rate at caution.
Is Bricktown safe at night?
Bricktown is busy and patrolled until the bars close, with an OKCPD division station on East Main Street and a 9 p.m. curfew for unaccompanied minors. Most crime there is theft. A teenager was shot outside the Bricktown movie theater late at night in June 2025, so leave by streetcar or rideshare from a busy corner.
What part of Oklahoma City is safest?
The far north. Ward 8, around Quail Springs, had 1.4 violent crimes per 1,000 residents in the reports, the lowest of the eight wards. Nichols Hills, a separate city almost surrounded by Oklahoma City, reported two violent crimes to the FBI in 2025.
Where should I stay in Oklahoma City?
For nightlife and events, stay in a downtown or Bricktown hotel and use the streetcar. For quieter streets, the Lake Hefner area, Quail Springs and the north side have the lowest rates. Midtown and the Plaza District are close to restaurants but rate higher than the north side.
Why is part of the map grey?
OKCPD does not publish open crime records, so the map uses its monthly reports for neighborhood associations. About 33.9% of residents live outside any association, and those areas have no data rather than no crime.
Is Oklahoma City crime going down?
Yes. Mayor David Holt reported 74 homicides in 2025, down from 78 in 2024. In the neighborhood reports, violent crime fell 2.8% and car thefts 26.3% against the same months a year earlier, while robberies rose slightly.