
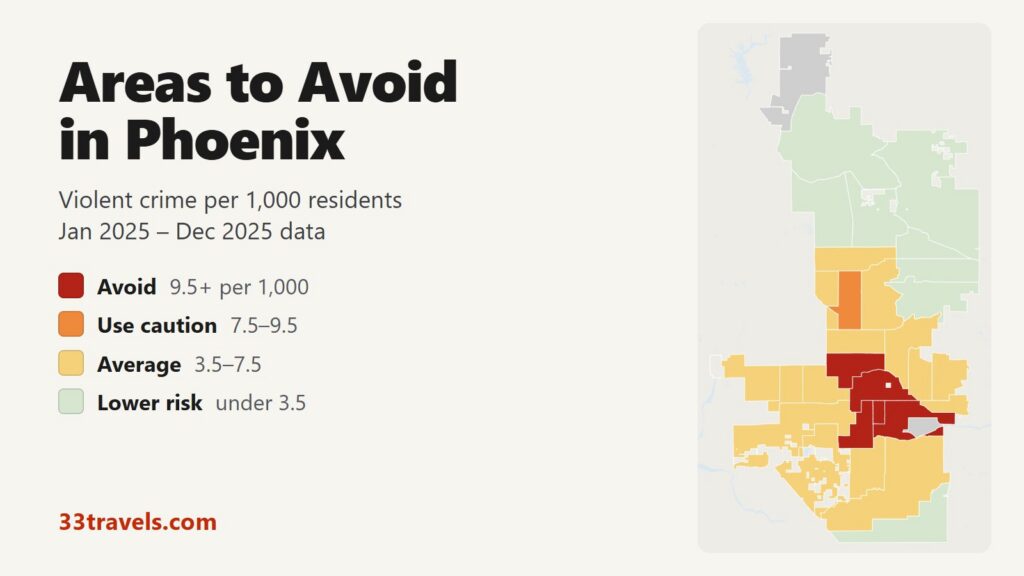
The areas to avoid in Phoenix form one block in the center of the city: Downtown and the rest of Central City south of McDowell Road, from 35th Avenue east to 44th Street, Encanto north of it up to Indian School Road, and South Alhambra along I-17 up to Bethany Home Road. In 2025, 5 areas recorded 9.5 or more violent crimes per 1,000 residents, against a city average of 5.4. Those five areas are home to 12% of Phoenix residents and account for 29% of its violent crime, 33% of its robberies and 37 of its 128 homicides.
Neighborhoods to avoid in Phoenix: Downtown, Central City West and Central City East in the center, from 35th Avenue east to 44th Street. Encanto, the Central Avenue corridor between McDowell and Indian School Roads. South Alhambra, the I-17 corridor from Indian School Road north to Bethany Home Road. No part of West Phoenix, South Phoenix or North Phoenix reaches the avoid line.
On FBI figures, Phoenix’s violent crime rate is 6.97 per 1,000, close to Philadelphia and Buffalo and about two thirds of St. Louis or Milwaukee. Only three areas reach twice the city average, so the avoid line here is 1.7 times the average. Downtown has the highest rate partly because only 12,896 people live there while ballgames, concerts and conventions bring in far larger crowds. Citywide, violent crime fell 9% in 2025 compared with 2024.
Phoenix safety map
Red areas are the places to avoid in Phoenix and orange marks the one area that calls for caution. The two grey areas have too few residents for a rate: Sky Harbor Airport and Rio Vista at the far north edge. Land left blank around the city belongs to Scottsdale, Tempe, Glendale and the other cities of the Valley, which have their own police. Use the buttons to zoom to Downtown & Central, West, South & Ahwatukee or North, and switch to Theft & robbery to see where shoplifting and car crime cluster. Tap or hover over an area for its numbers.
Violent crimes per 1,000 residents
Thefts & robberies per area
Tap or hover a neighborhood to see its numbers.
Table of Contents
- Areas to avoid in Phoenix
- Areas to be careful in
- Is downtown Phoenix safe?
- Is Roosevelt Row safe during First Friday?
- Is Maryvale safe?
- Is South Phoenix safe?
- Is the Phoenix light rail safe?
- Phoenix crime rate
- Car theft and shoplifting in Phoenix
- Safest neighborhoods to stay in Phoenix
- Scottsdale, Tempe and the suburbs
- Phoenix safety tips for visitors
- How this map was made
- FAQ
Areas to avoid in Phoenix
These are the 5 areas with 9.5 or more violent crimes per 1,000 residents. Phoenix has no official neighborhood map, so the areas are the city’s urban villages, with the larger villages split into parts along major roads. Three of the five are pieces of Central City.
| Area | Urban village | Violent crimes per 1,000 | vs. city avg | Homicides | Aggravated assaults | Thefts + robberies |
|---|---|---|---|---|---|---|
| DowntownCentral City | Central City | 23.0 | 4.2x | 7 | 186 | 972 |
| Central City WestCentral City | Central City | 19.4 | 3.6x | 7 | 220 | 596 |
| Central City EastCentral City | Central City | 18.1 | 3.3x | 7 | 397 | 1,238 |
| EncantoEncanto | Encanto | 9.6 | 1.8x | 3 | 369 | 1,431 |
| South AlhambraAlhambra | Alhambra | 9.5 | 1.8x | 13 | 499 | 2,070 |
Downtown
Downtown runs from 7th Avenue to 7th Street and from McDowell Road down to Buckeye Road. It holds City Hall, the Convention Center, Chase Field, Footprint Center, Hance Park, the Burton Barr Central Library and the galleries of Roosevelt Row. Its rate of 23.0 per 1,000 is the highest in Phoenix, 4.2 times the city average. It recorded 296 violent crimes among 12,896 residents, while its event and office crowds are many times larger.
Central City West: the Capitol and the Human Services Campus
Central City West (19.4) covers Central City west of 7th Avenue, out to I-17 and 35th Avenue and south to Broadway Road. It holds the State Capitol and the Human Services Campus at 12th Avenue and Jackson Street. About a quarter of the area’s 316 violent crimes were recorded in the single police grid around the campus. The large tent camp known as “the Zone” was cleared in 2023. In a June 2026 count, 283 people were sleeping on the streets around the campus, with no large encampment.
Central City East
Central City East (18.1) stretches from 7th Street east to 44th Street, between McDowell Road and the Salt River, and wraps around the airport. With 33,444 residents it is the largest of the three Central City areas and recorded 605 violent crimes and 7 homicides. It holds Eastlake Park, the Pueblo Grande ruins and Valleywise Health Medical Center on East Roosevelt Street, whose police grid alone recorded about one in twelve of the area’s violent crimes.
Encanto
Encanto (9.6) holds the Phoenix Art Museum and the Heard Museum. It runs along Central Avenue from McDowell Road to Indian School Road, between I-17 and SR-51, and also contains Encanto Park, Phoenix College, Steele Indian School Park, the State Fairgrounds and the Melrose arch on 7th Avenue. Encanto sits just over the avoid line. With 59,461 residents it recorded 568 violent crimes and 1,304 thefts, the second-most thefts in Phoenix.
South Alhambra and the I-17 corridor
South Alhambra (9.5) runs from 43rd Avenue east to 7th Street, between Bethany Home Road and Indian School Road, with I-17 through the middle. It recorded more violent crimes (750), aggravated assaults (499), robberies (186) and stolen vehicles (380) than any other area, and tied East Maryvale for the most homicides (13). It is also the most populous avoid area, with 78,624 residents. It holds Christown Spectrum and Grand Canyon University. A single retail address on North 19th Avenue near Christown accounts for about a third of South Alhambra’s 1,884 thefts.
Areas to be careful in
Only one area falls between 7.5 and 9.5 violent crimes per 1,000 residents. North Mountain Central covers the I-17 corridor between 19th and 35th Avenues, from Northern Avenue up to Greenway Road, including the old Metrocenter mall site. It recorded 573 violent crimes, the third-most of any area, and 339 stolen vehicles. Sunnyslope, east of 19th Avenue around the North Mountain preserve, is in North Mountain East and rates 5.7.
| Area | Urban village | Violent crimes per 1,000 | vs. city avg | Homicides | Aggravated assaults | Thefts + robberies |
|---|---|---|---|---|---|---|
| North Mountain CentralNorth Mountain | North Mountain | 8.5 | 1.6x | 6 | 412 | 1,307 |
Is downtown Phoenix safe?
Yes, for the things visitors do there. Games at Chase Field and Footprint Center, conventions and the Downtown hotels fill the streets between the arenas and the Convention Center. The crime visitors are most likely to meet is theft: Downtown recorded 899 thefts and 113 stolen vehicles, against 296 violent crimes and 73 robberies.
The blocks west of 7th Avenue are a different matter. The streets around the Human Services Campus at 12th Avenue and Jackson Street, in Central City West, have no attractions and are where the street count described above was taken.
Is Roosevelt Row safe during First Friday?
Roosevelt Row is inside the Downtown area, so its numbers are part of Downtown’s. Late on First Friday nights it has had trouble: two people were shot near 5th Street and Roosevelt in March 2026, after the art walk had ended. In April 2026 organizers ended the street closure and outdoor market. In September the City Council approved a one-year pilot that brings vendors back on private property only. Both shootings happened after the galleries had closed, so the safest time to visit is early in the evening.
Is Maryvale safe?
Maryvale rates 5.5 per 1,000, about the city average, and none of its three areas reaches the avoid or caution line. East Maryvale, between 35th and 59th Avenues, is the highest at 6.8 and shares the most homicides of any area (13) with South Alhambra. Central Maryvale (5.1) and West Maryvale (4.5) sit below average for violent crime, though West Maryvale ranks fifth for stolen vehicles (325). Camelback Ranch, a spring training ballpark, is in West Maryvale.
Is South Phoenix safe?
South Phoenix, the South Mountain village between the Salt River and South Mountain Park, rates 6.1 per 1,000. South Mountain West (6.3) and South Mountain East (6.0) both sit near the average, and neither is an avoid area. South Mountain East recorded 1,266 thefts, the third-most in the city. South Mountain Park, the largest municipal park in the country, has few residents. Heat is the main risk on its trails. Laveen, to the west, rates 5.2.
Is the Phoenix light rail safe?
Valley Metro reports that rail security incidents fell by more than half in fiscal 2025 after it increased its security presence by 40%. It runs two light rail lines, A and B, through Downtown, along Central Avenue and out to Sky Harbor’s 44th Street station, where the free PHX Sky Train continues to the terminals. Phoenix Transit Police, part of Phoenix PD, patrol the Phoenix segments, and Valley Metro’s own security officers patrol the system. Check valleymetro.org for current late-night hours before relying on the last train.
Phoenix crime rate
Phoenix recorded 8,793 violent crimes in 2025 in its public crime file, down from 9,659 in 2024. Robbery and aggravated assault each fell 9%, burglary fell 18% and theft fell 11%. The department’s own report counts 130 criminal homicides in 2025, down from 146 in 2024. Those totals include negligent manslaughter, so they run above the map’s count.
By village, Central City leads with 19.5 per 1,000, followed by Encanto (9.6) and Alhambra (8.2). North Mountain (6.2), South Mountain (6.1) and Maryvale (5.5) sit near the average. The north and southeast are far lower: Paradise Valley 2.4, Ahwatukee Foothills 1.3 and Desert View 1.1, the lowest of the villages.
Car theft and shoplifting in Phoenix
Phoenix recorded 4,998 stolen vehicles in 2025, down 24% from 6,592. South Alhambra (380) and Estrella (371) lost the most, followed by North Mountain Central and the Maryvale areas. Estrella’s northern part along I-10 is an employment district, and its violent crime rate is below average.
Theft outnumbers violent crime in every area of Phoenix. The city recorded 23,116 thefts, led by South Alhambra (1,884), Encanto (1,304) and South Mountain East (1,266). Single stores can dominate an area’s count, as in South Alhambra and Arcadia. The public file does not separate thefts from vehicles, so lock the car, park in lit lots and keep bags out of sight everywhere, including hotel and trailhead lots.
Safest neighborhoods to stay in Phoenix
Desert View, around Desert Ridge and the Mayo Clinic Hospital campus in the far northeast, has the lowest rate of any Phoenix area at 1.1 per 1,000. Ahwatukee Foothills (1.3), on the south side of South Mountain, and the three Paradise Valley areas are also well below average. Closer to the center, Biltmore (5.3), home to the Arizona Biltmore resort and Biltmore Fashion Park, sits at the city average, and Arcadia (4.2), east of 40th Street, below it.
| Area | Urban village | Violent crimes per 1,000 | vs. city avg | Homicides | Aggravated assaults | Thefts + robberies |
|---|---|---|---|---|---|---|
| Desert ViewDesert View | Desert View | 1.1 | 0.2x | 1 | 48 | 346 |
| Ahwatukee FoothillsAhwatukee Foothills | Ahwatukee Foothills | 1.3 | 0.2x | 2 | 78 | 533 |
| South Paradise ValleyParadise Valley | Paradise Valley | 1.7 | 0.3x | 1 | 66 | 454 |
| North Paradise ValleyParadise Valley | Paradise Valley | 2.3 | 0.4x | 2 | 92 | 300 |
| ArcadiaCamelback East | Camelback East | 4.2 | 0.8x | 3 | 82 | 692 |
| West Camelback EastCamelback East | Camelback East | 4.4 | 0.8x | 3 | 135 | 1,154 |
| BiltmoreCamelback East | Camelback East | 5.3 | 1.0x | 1 | 156 | 934 |
Scottsdale, Tempe and the suburbs
The cities around Phoenix report a violent crime rate of 2.65 per 1,000 combined, well under Phoenix’s 6.97 on the same FBI basis. Scottsdale, Chandler and Gilbert report about a quarter of Phoenix’s rate or less. Glendale, Mesa and Tempe report about 60% of it. Tempe holds Arizona State University’s main campus and Mill Avenue’s bars, and Glendale holds State Farm Stadium. Surprise, Chandler and Gilbert report few violent offenses to the FBI for their size.
| City | Population | Violent crimes | Per 1,000 | Year |
|---|---|---|---|---|
| Phoenix | 1,688,662 | 11,776 | 7.0 | 2025 |
| Glendale | 260,498 | 1,141 | 4.4 | 2025 |
| Mesa | 519,990 | 2,210 | 4.3 | 2025 |
| Tempe | 191,348 | 799 | 4.2 | 2025 |
| Avondale | 98,457 | 336 | 3.4 | 2025 |
| El Mirage | 36,598 | 93 | 2.5 | 2025 |
| Peoria | 201,962 | 510 | 2.5 | 2025 |
| Goodyear | 123,911 | 292 | 2.4 | 2025 |
| Scottsdale | 247,258 | 433 | 1.8 | 2025 |
| Buckeye | 120,174 | 191 | 1.6 | 2025 |
| Queen Creek | 90,750 | 143 | 1.6 | 2025 |
| Chandler | 282,191 | 351 | 1.2 | 2025 |
| Gilbert | 293,851 | 345 | 1.2 | 2025 |
| Surprise | 173,922 | 149 | 0.9 | 2025 |
Murder, rape, robbery and aggravated assault reported to the FBI by each agency, per 1,000 residents of the population the agency reports. Source: FBI Crime Data Explorer. Agencies that report no complete year are left out.
Phoenix safety tips for visitors
- Treat heat as the main risk from May to September. Carry water on every hike and start before sunrise.
- Leave nothing visible in a parked car, at trailheads as much as at malls and hotels.
- Stay east of 7th Avenue when walking between Downtown venues at night.
- Visit Roosevelt Row on First Friday early in the evening.
- Check valleymetro.org for last-train times before a late night out.
- Call 911 in an emergency and Phoenix PD’s non-emergency line, 602-262-6151, to report a theft or a car break-in.
How this map was made
Crime counts come from the Phoenix Police Department’s public crime file for January 2025 through December 2025. Phoenix PD switched to the FBI’s NIBRS system in September 2025 and has not updated the public file since the end of 2025, so 2025 is the latest complete year. The file holds one record per incident with only its most serious offense, so violent counts run about a quarter below the 11,776 violent crimes Phoenix reported to the FBI for the same year. Violent crime means murder, rape, robbery and aggravated assault. Simple assault, added to the file in September 2025, is not counted. The file has no map coordinates, so each crime is placed by its police grid cell, and cells that cross an area boundary are split by population. Population is the 2020 Census count by block.
Phoenix has no official neighborhoods. The areas are the 15 urban villages, with the largest split along major roads into two to four parts, Downtown cut out of Central City and Sky Harbor Airport kept separate. The tiers are Avoid (9.5 or more violent crimes per 1,000 residents), Use caution (7.5 to 9.5), Average (3.5 to 7.5) and Lower risk (under 3.5). Areas with fewer than 5,000 residents get no rate. Crimes handled by ASU Police, by Arizona DPS at the Capitol and on the freeways, by the Gila River and Salt River tribal police, by the Maricopa County Sheriff in county islands and by Tempe and Mesa police on their light rail segments are not in Phoenix PD’s file. The suburban table uses each department’s reports to the FBI’s Crime Data Explorer.
We built the same map for the areas to avoid in Chicago, the areas to avoid in New York City, the areas to avoid in San Francisco, the areas to avoid in Los Angeles, the areas to avoid in Miami, the areas to avoid in Atlanta, the areas to avoid in Baltimore, the areas to avoid in Detroit, the areas to avoid in Austin, the areas to avoid in Philadelphia, the areas to avoid in St. Louis, the areas to avoid in Boston, the areas to avoid in Denver, the areas to avoid in Houston, the areas to avoid in San Diego, the areas to avoid in Milwaukee, the areas to avoid in Buffalo and the areas to avoid in Jacksonville.
FAQ
What are the most dangerous neighborhoods in Phoenix?
By violent crime per resident, the highest rates are in Downtown (23.0 per 1,000), Central City West (19.4) and Central City East (18.1), followed by Encanto and South Alhambra. By count, South Alhambra recorded the most violent crimes, 750, and the most aggravated assaults.
Is Phoenix safe for tourists?
Yes, in the places tourists go. The resorts in Biltmore, Arcadia and Desert Ridge sit at or below the city average, and Scottsdale and the other suburbs report much lower rates. Downtown's high rate reflects its small population and large crowds; theft is the main risk there.
Is Phoenix more dangerous than other big cities?
No. On FBI figures Phoenix recorded 6.97 violent crimes per 1,000 residents in 2025, close to Philadelphia and Buffalo.
Is Ahwatukee safe?
Yes. Ahwatukee Foothills, on the south side of South Mountain, rates 1.3 violent crimes per 1,000 residents, about a quarter of the Phoenix average and one of the lowest rates in the city.
Where should I stay in Phoenix?
Biltmore, home to the Arizona Biltmore resort and Biltmore Fashion Park, sits at the city average. For the lowest rates, Desert Ridge in Desert View (1.1 per 1,000) and Ahwatukee Foothills both rate far below average, and Scottsdale's rate is about a quarter of Phoenix's.
Why is this map based on 2025 data?
Phoenix PD moved to the FBI's NIBRS reporting system in September 2025 and has not published new incident records since the end of 2025. 2025 is the latest complete year in the public file.